June 6, 2024
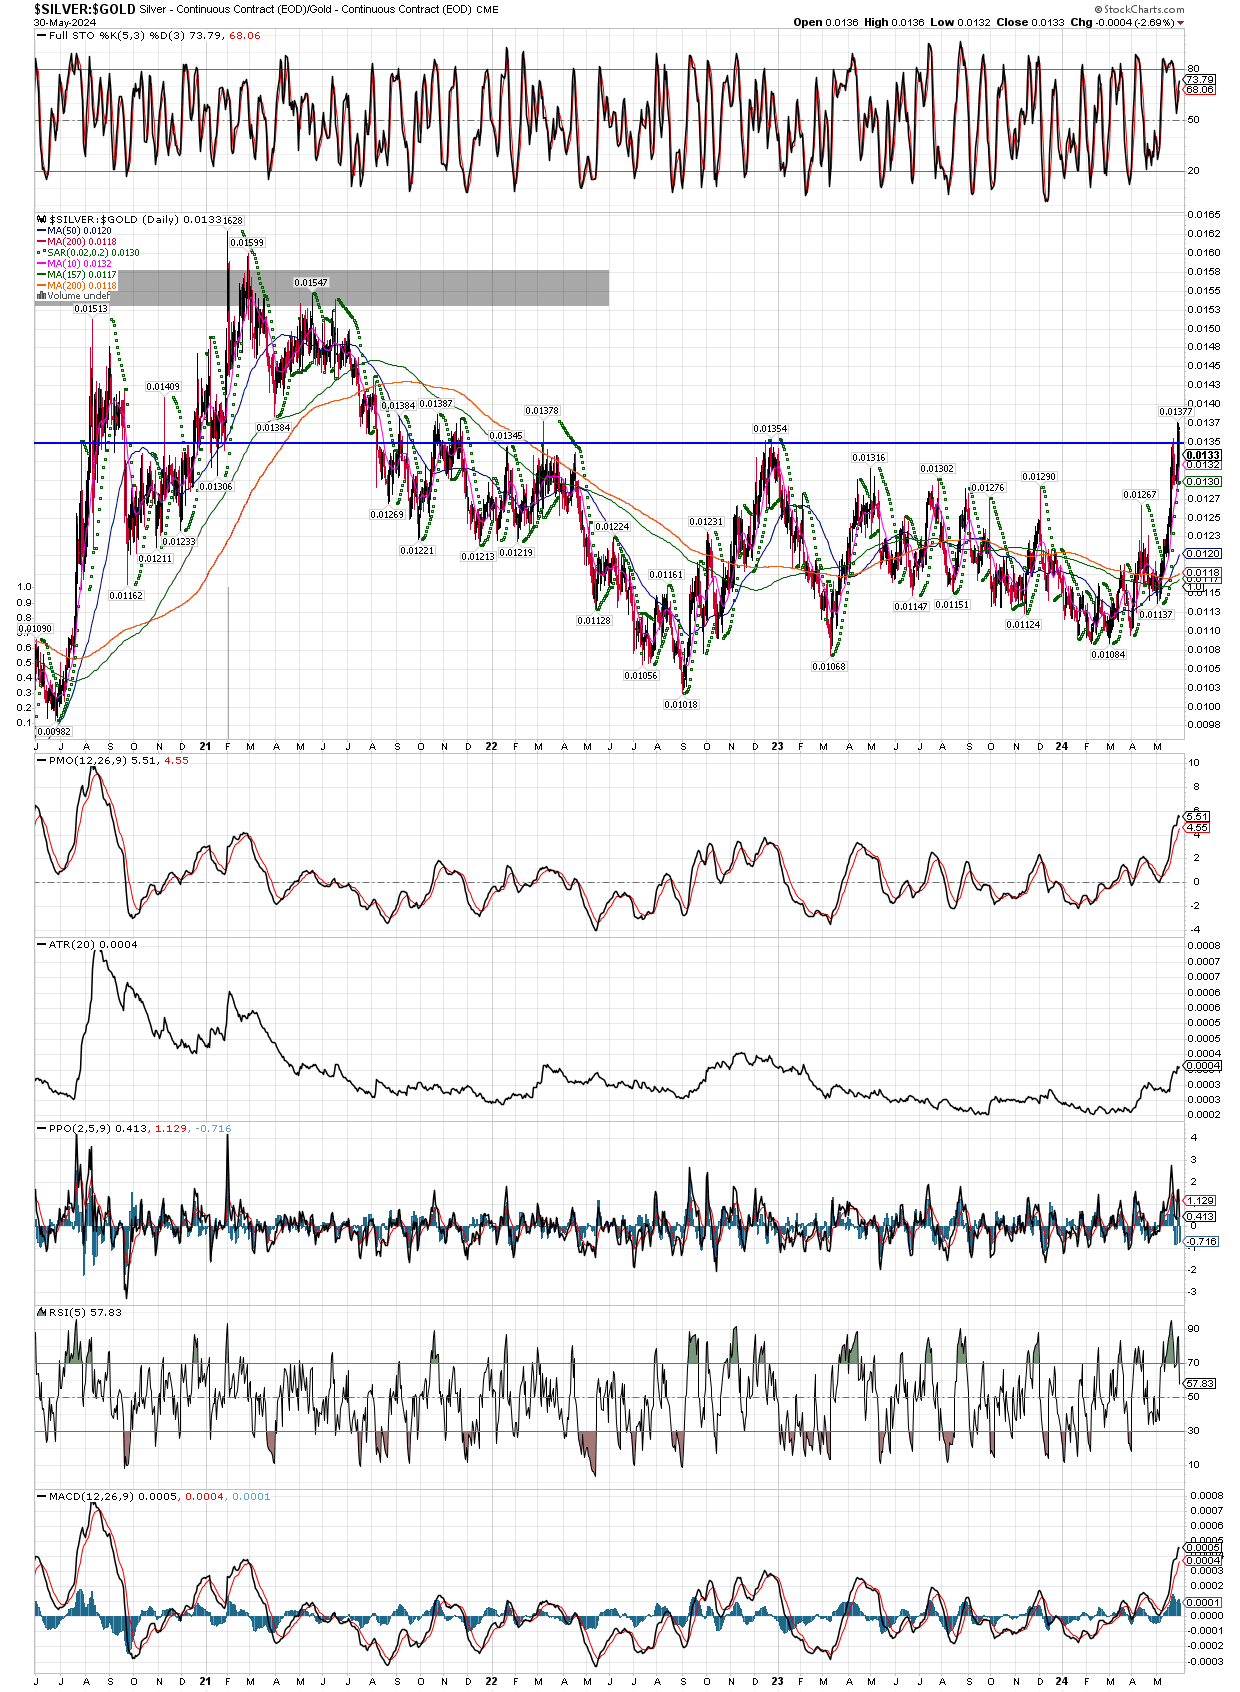
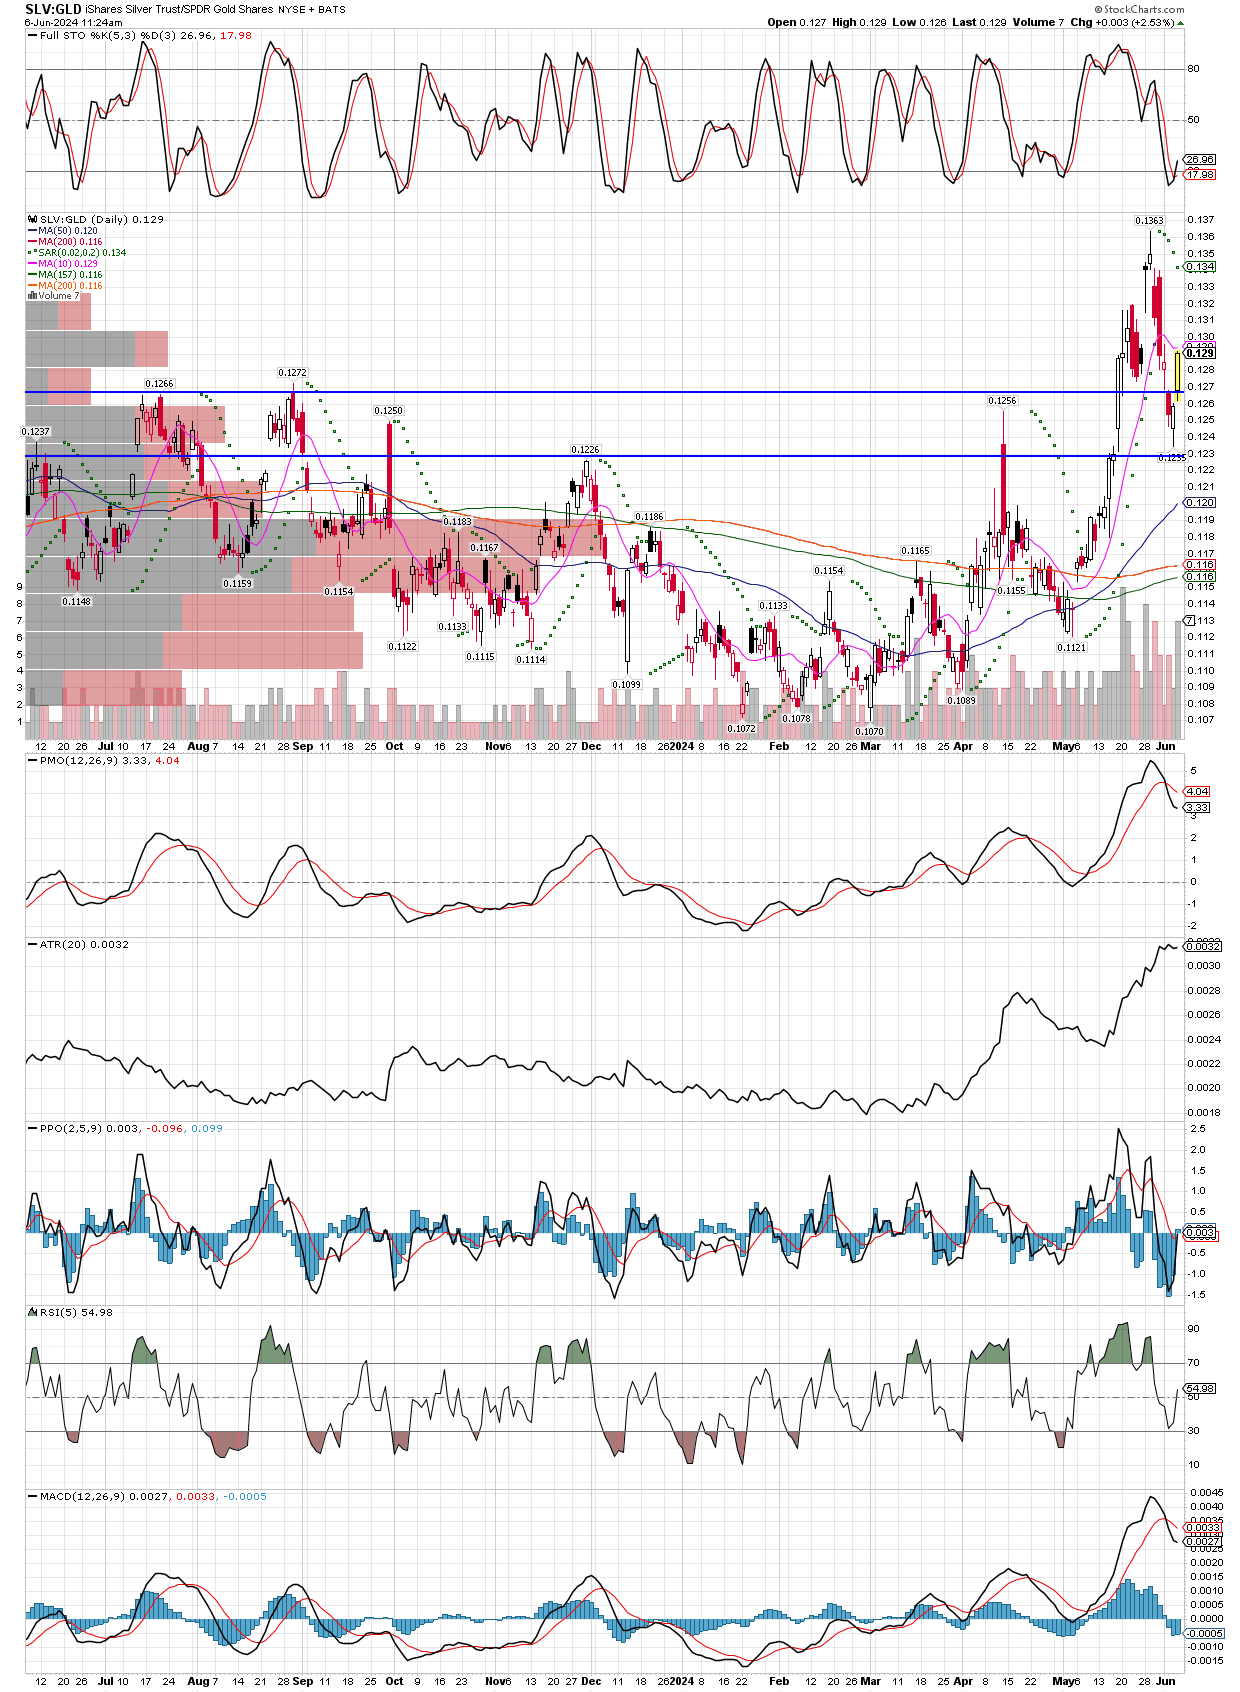
First is the SLV:GLD ratio, rebounding hard out of the support zone. As this chart trends higher, it reaffirms the bull market is underway. Oversold stochastics suggests this ratio has several more days upside, at least.
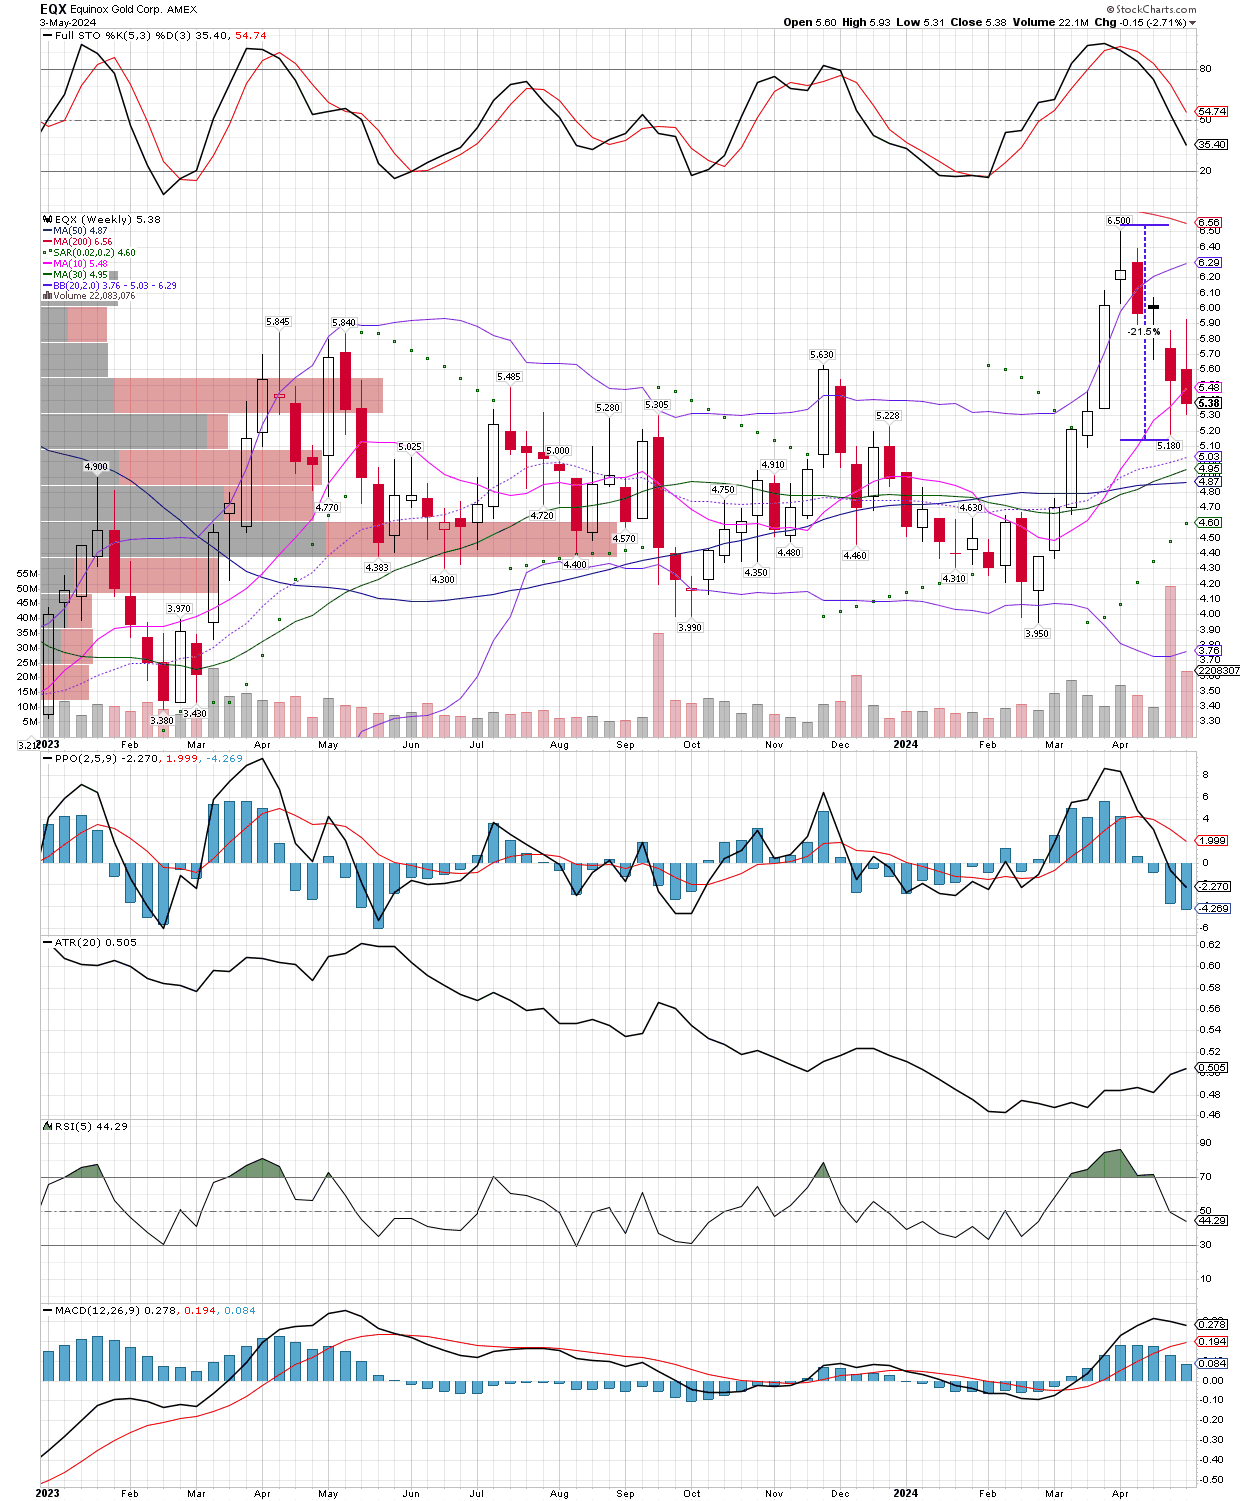
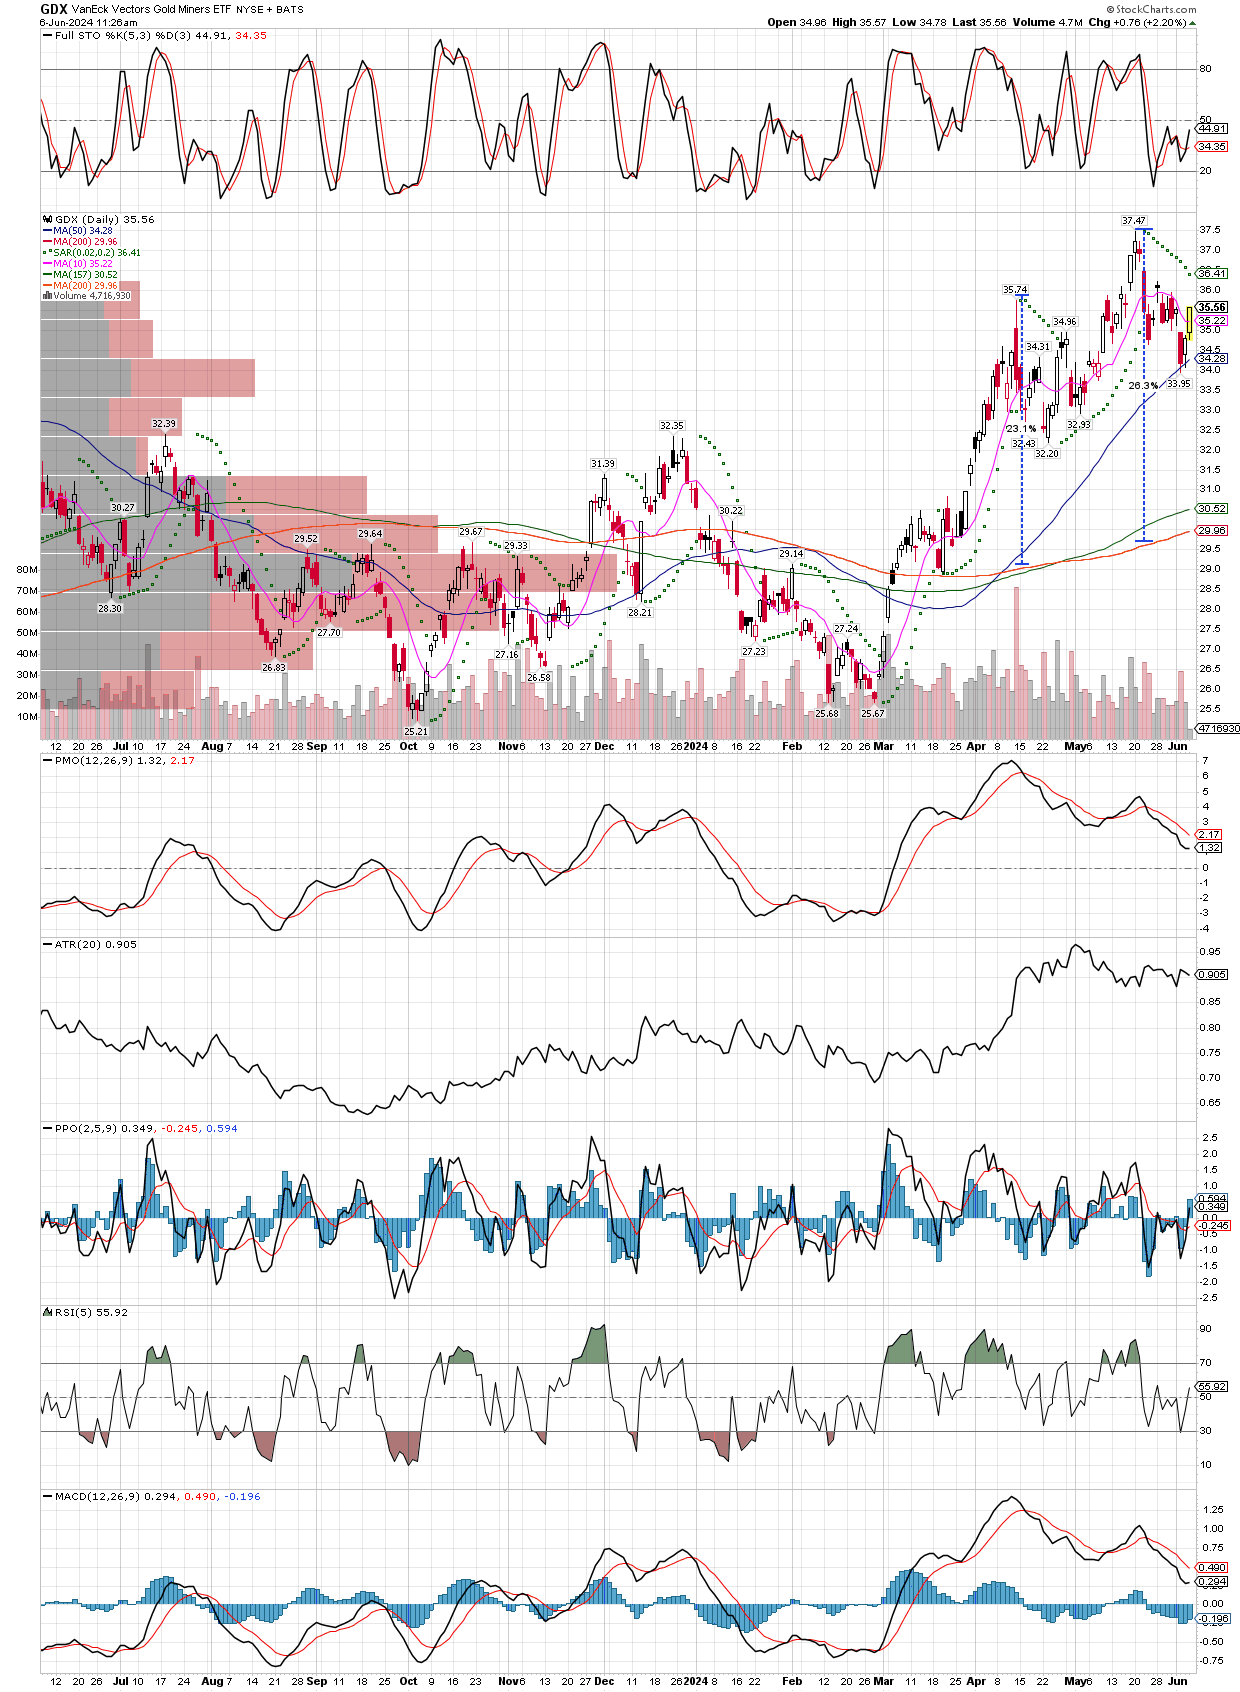
Next, we have the GDX daily chart, where I have measured the distance from the 200 day moving average thus far in this bull market. There is no way I will sell anything unless the GDX is at least 50-60% above it’s 200 day MA, as this typically is when the miners take a more significant break in their upside move. Until then, dips are to be bought, I don’t try to avoid them by selling and trying to buy back in at cheaper prices, because that is how one gets left behind.
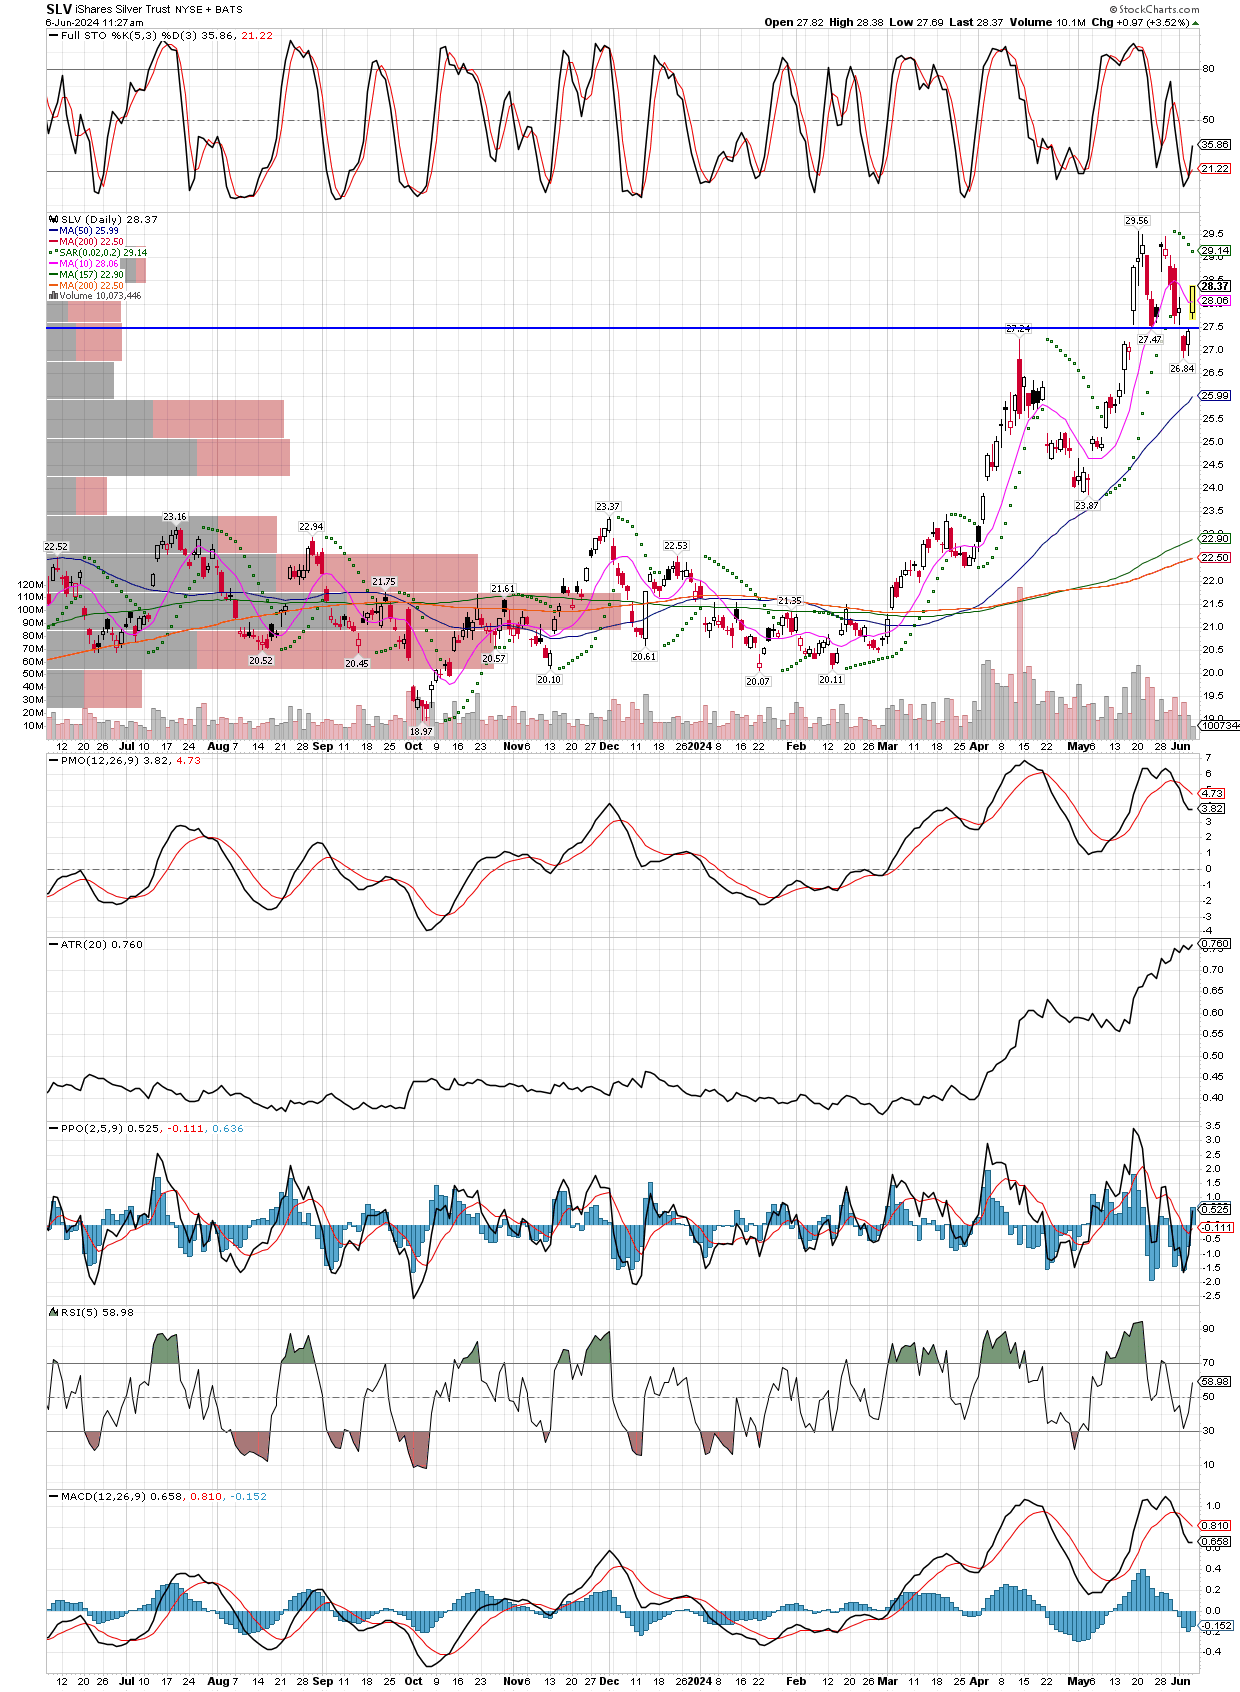
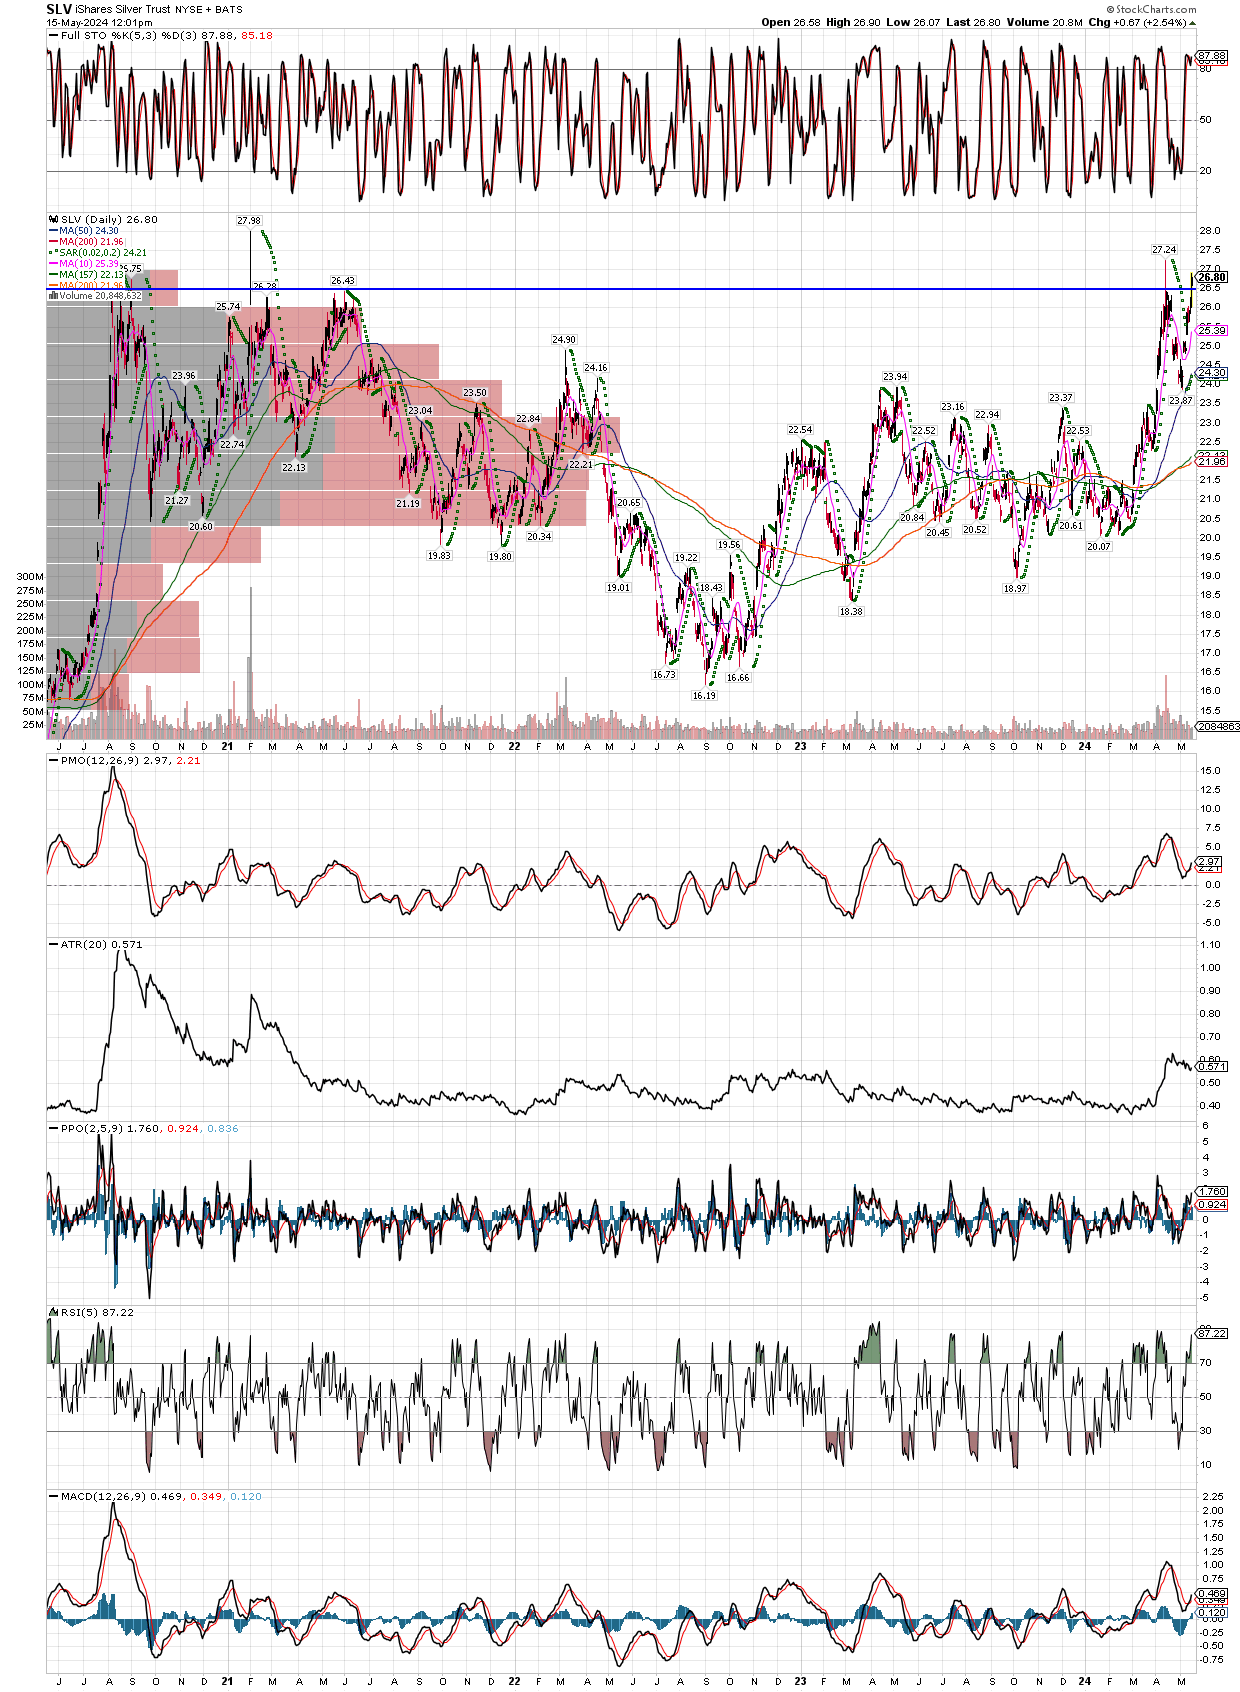
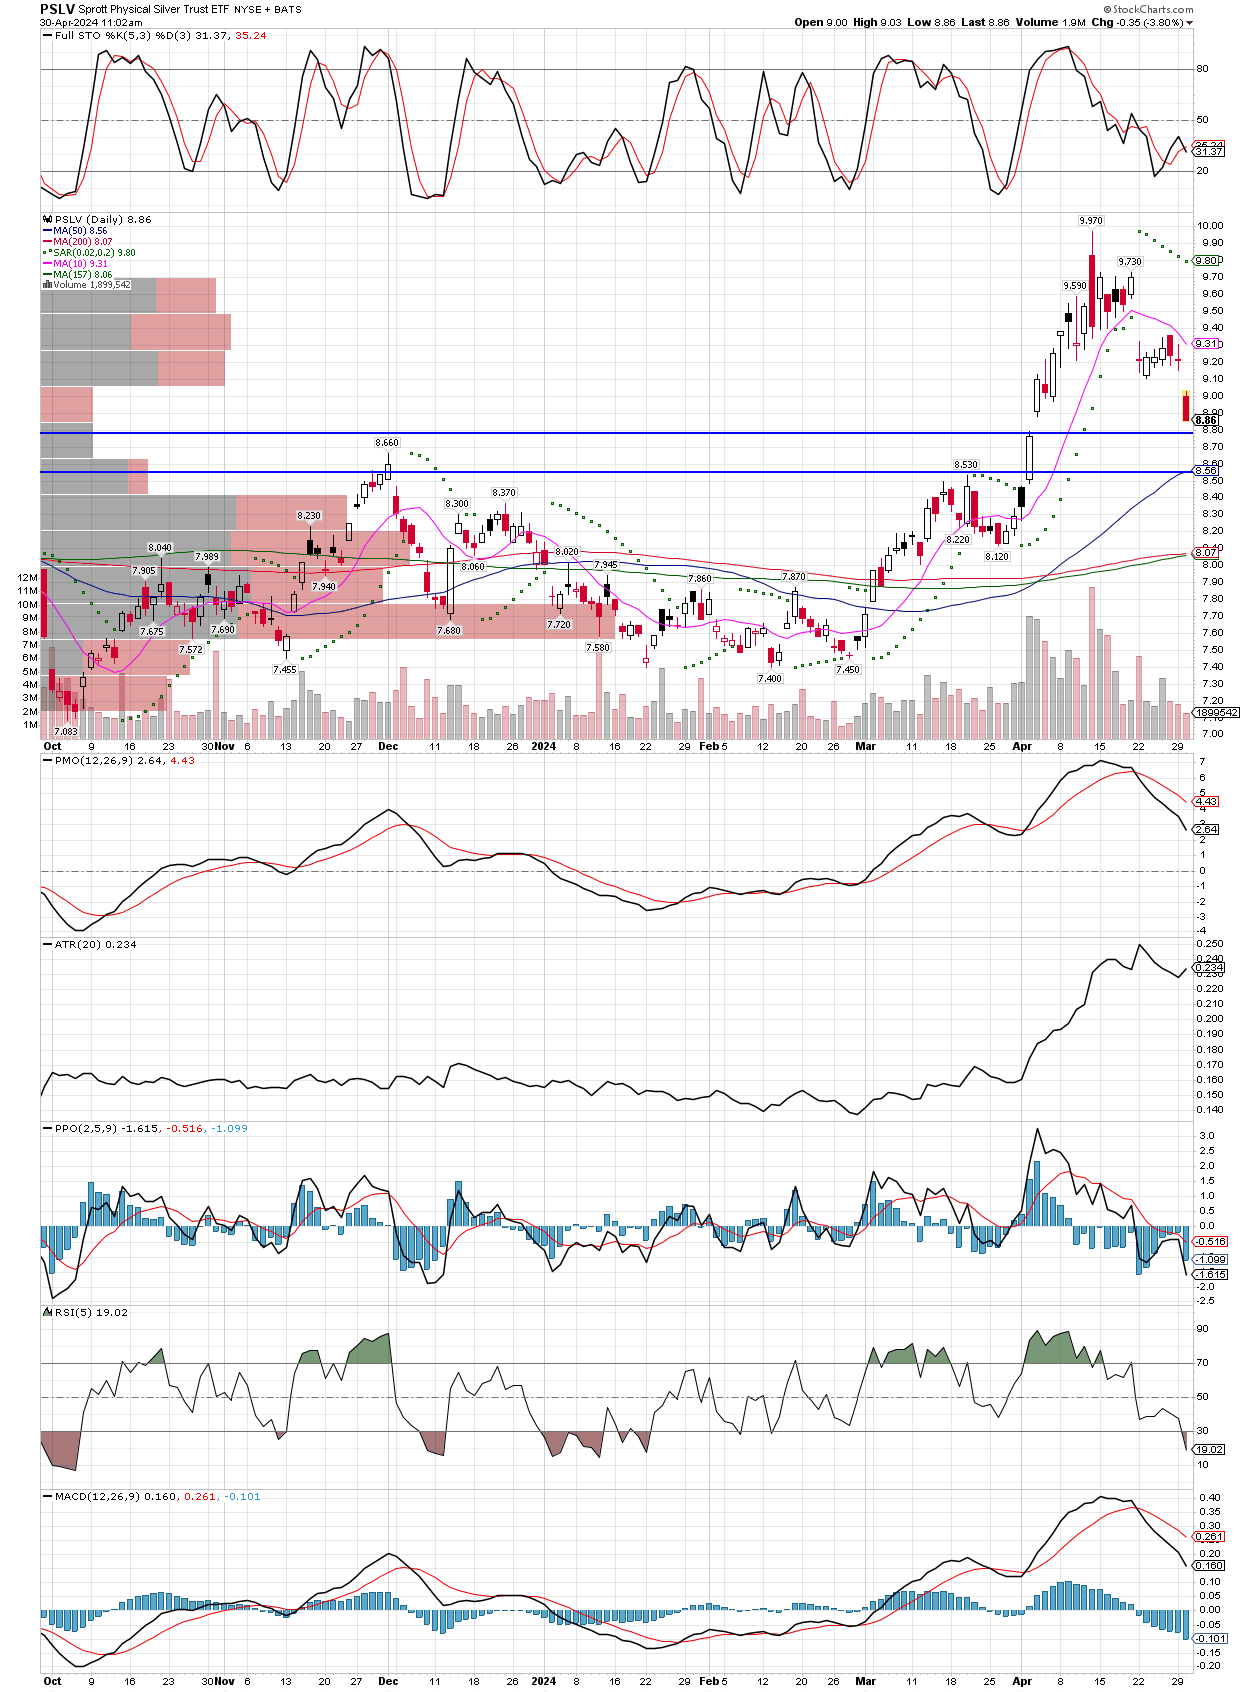
Now for the SLV daily chart. We see the oversold stochastics again, accompanying this sharp rally, pushing SLV back over its 10 day MA. It’s a sign that this pull back might have already ended. If it has, great because we added to many positions over the last few days, and it it isn’t the near term end of the correction, we will get a chance to add some more. However, bounces out of declines with this much force should not be ignored. Just like that, silver is only about $1.50 from new bull market highs, after taking out long held resistance. Note that it also bounced out of the new support area, which is the old resistance area.