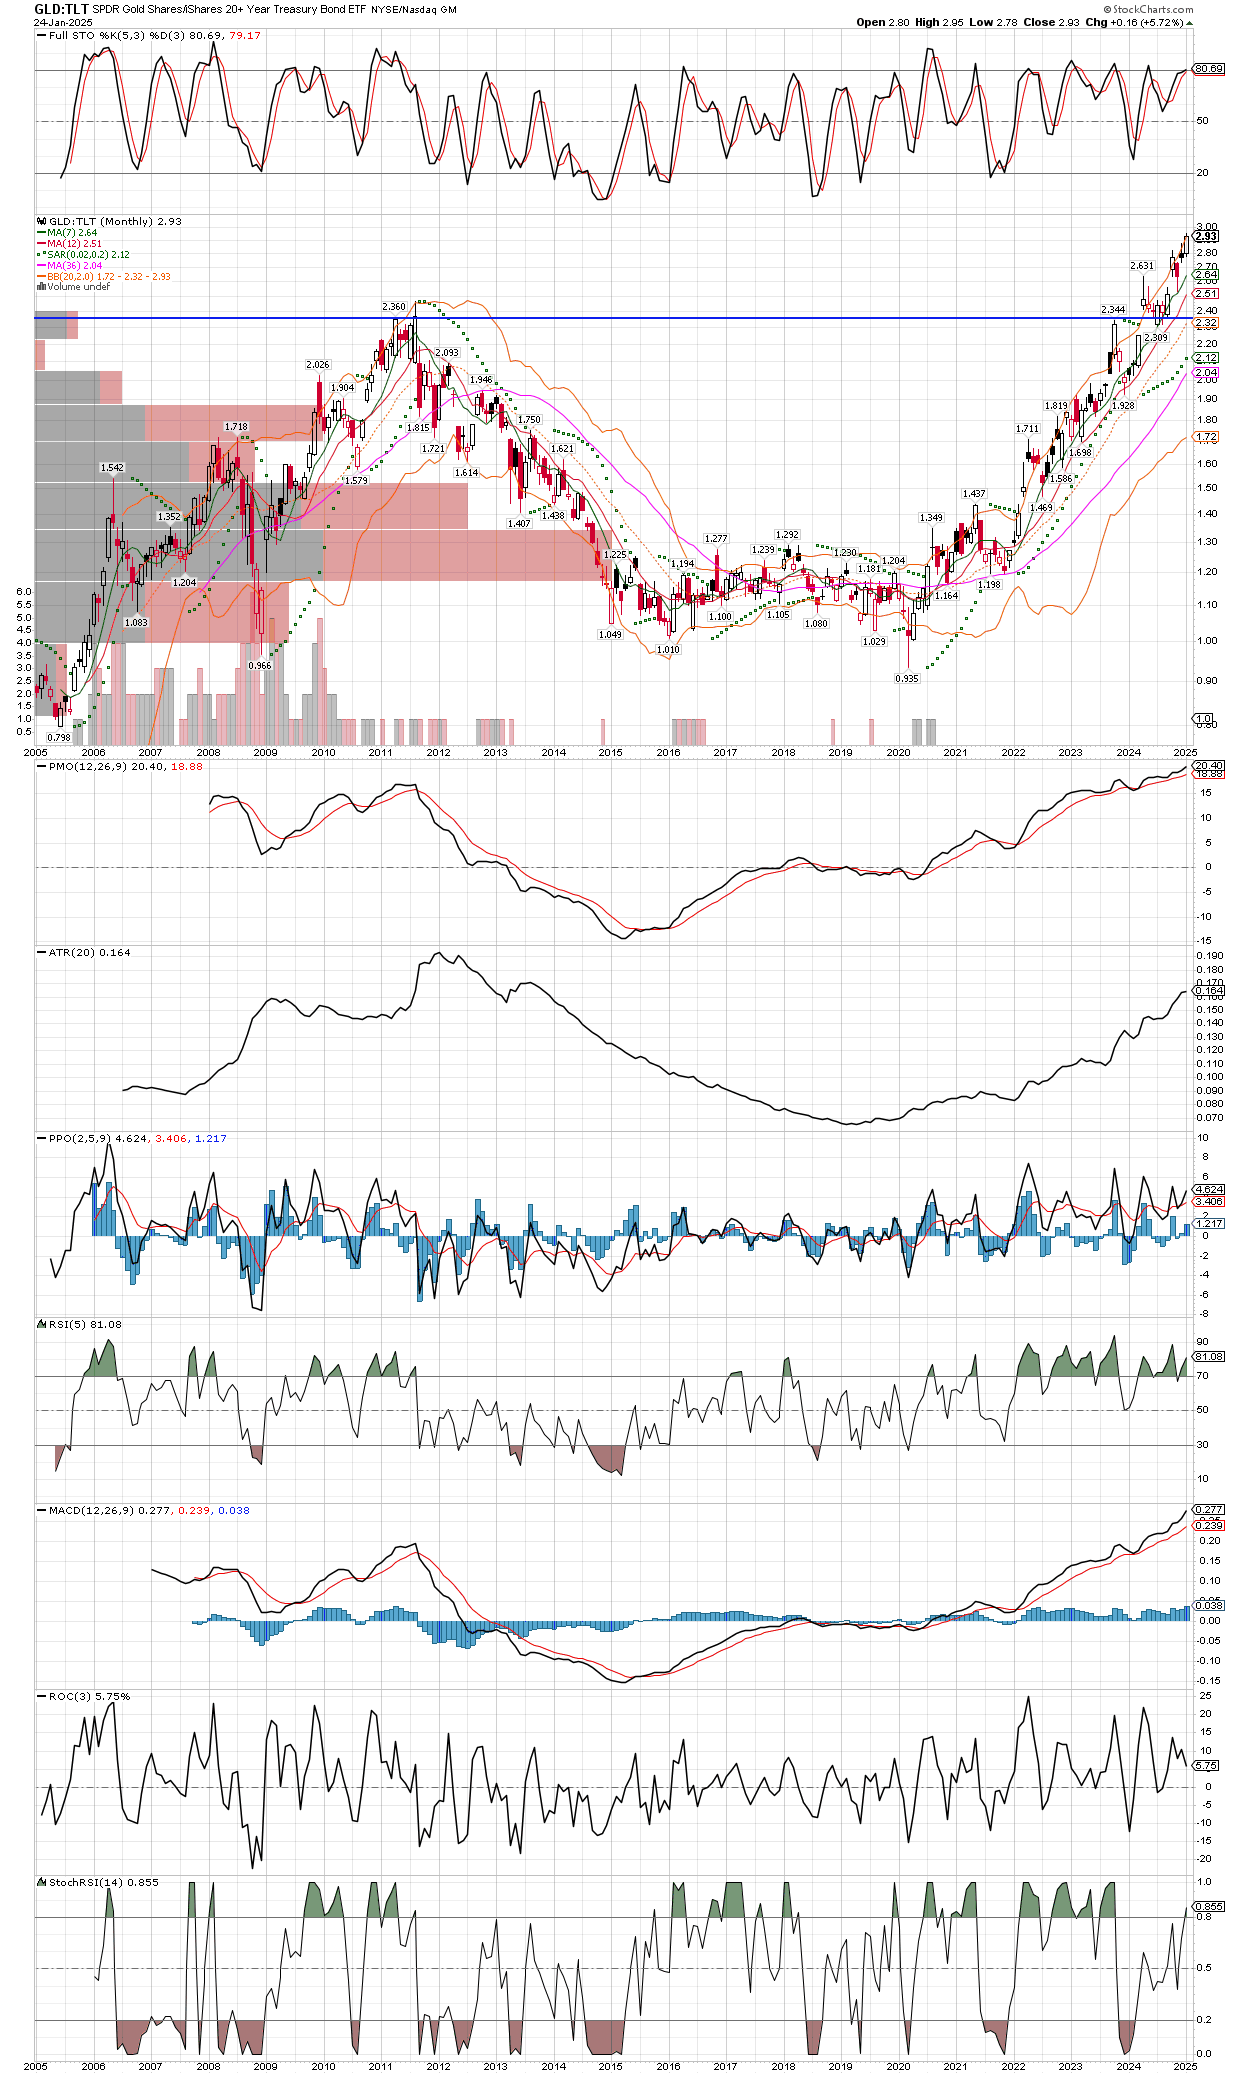
Eye-opening chart as to how well gold has performed, in this case vs. the world’s largest safe-haven market, US Treasury bonds. It’s shocking to me that miners of precious metals are scraping all time lows as far as valuations versus the metals, while gold is performing as well as it is. It also might be time to consider owning some bonds, though I will stick to the metals and their miners, since bonds were in a 40 year bull market and the trend is not in their favor. Still, bonds can benefit from a weak stock market, which many believe is inevitable. Stocks are due for a large correction, but if the Fed keeps printing to keep assets afloat (inflationary), bonds should not rise as much as precious metals.
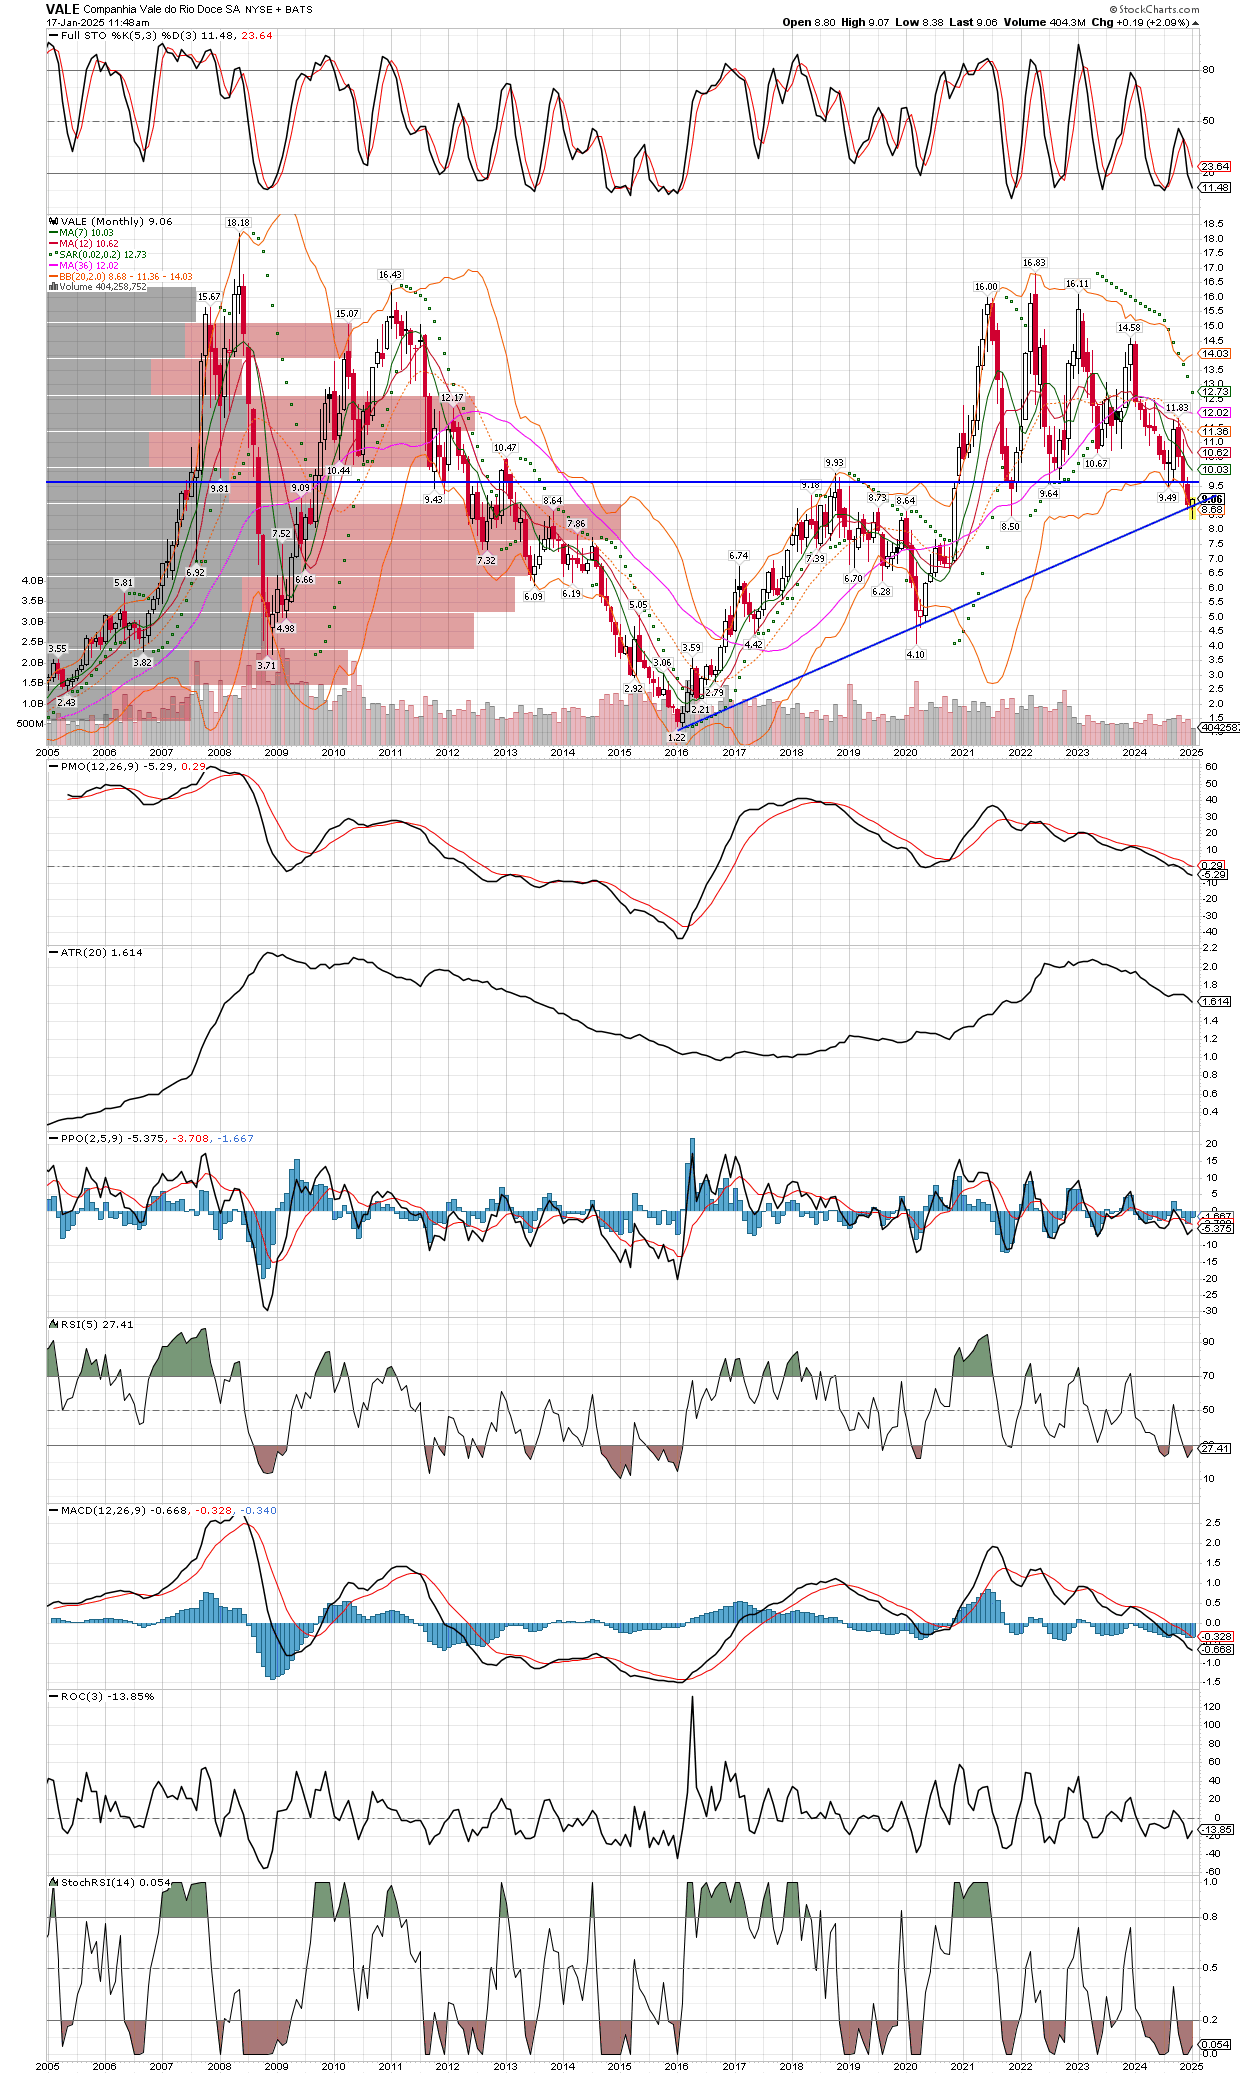
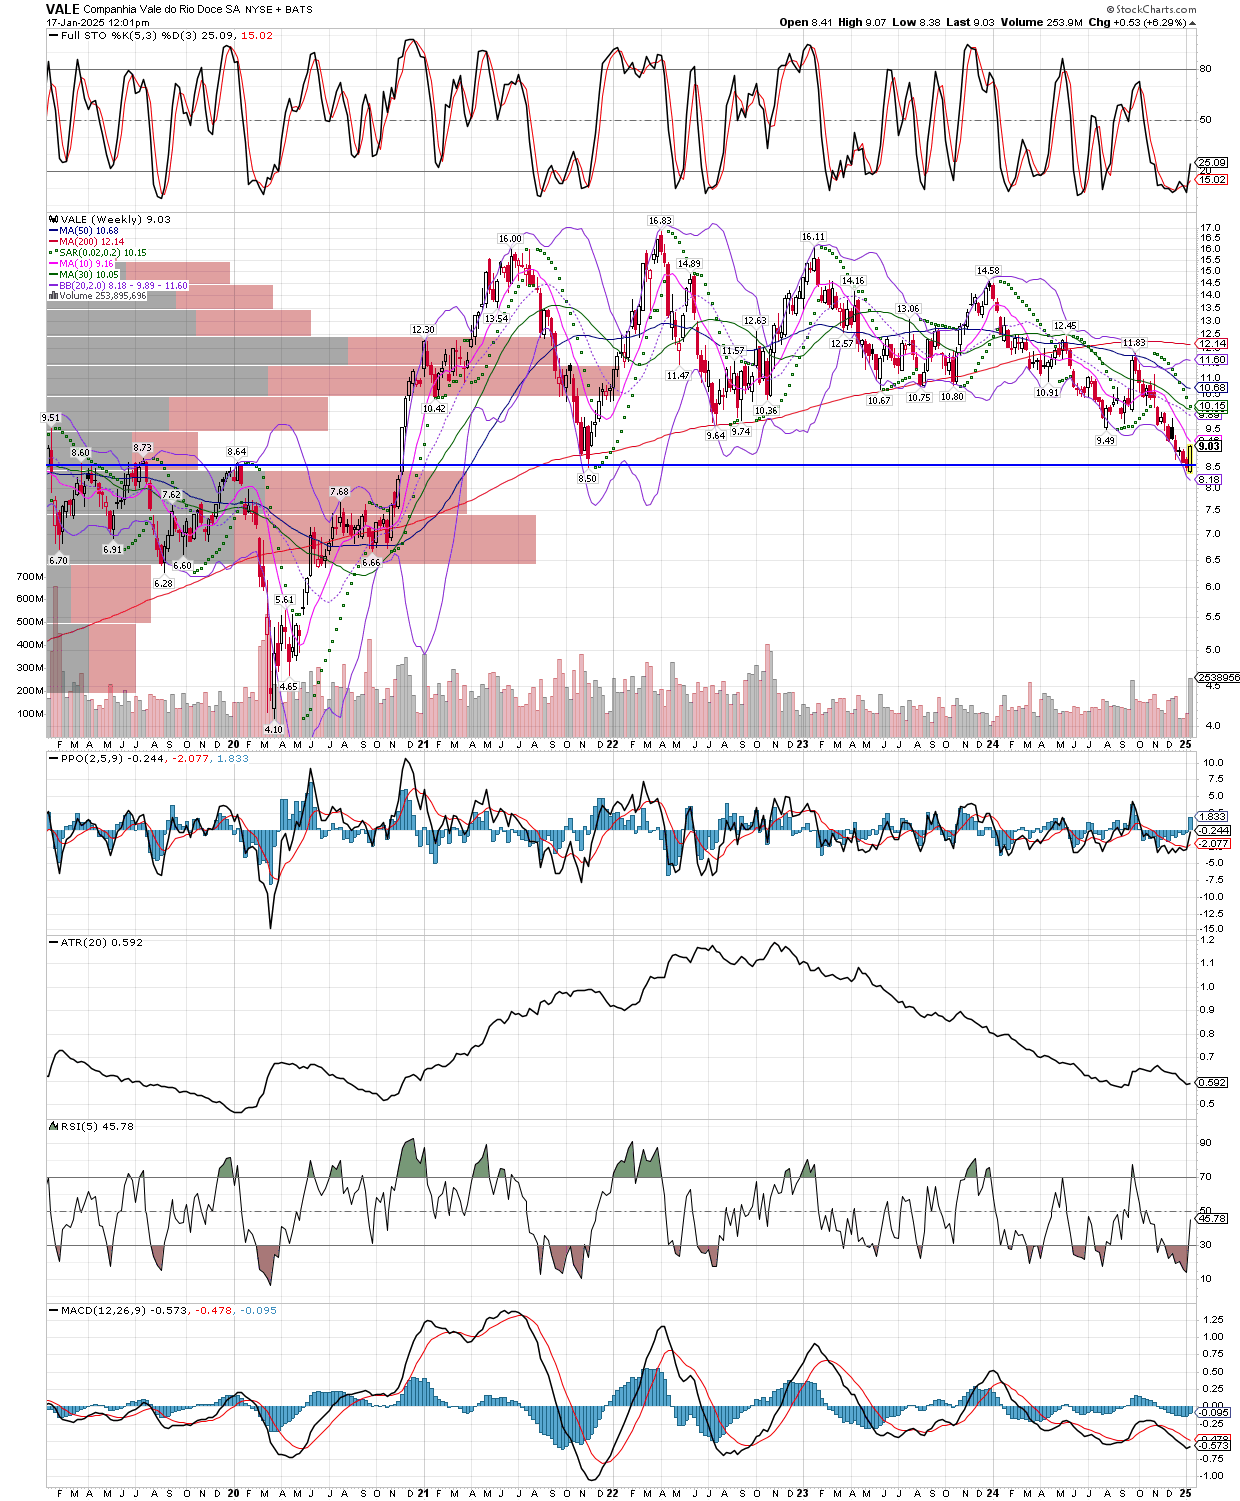
It’s far too early to say the basic materials stocks like VALE, and BHP are turning around, yet they all had very high volume on the turn higher yesterday, and I have been waiting patiently for them to put a bottom in. Situations like this can take time, so patience is necessary, but since we are in a commodity bull market and the USD appears to have at least found a temporary top, I am inclined to start a position in Vale soon. When they have growing earnings they pay out some hefty dividends. I typically wait for an uptrend to be established, as defined by the daily moving averages all heading higher with the 50 day above the 200 day MA, but that will take some time to materialize in Vale, as its trading so far below the MAs. These cases can work well, and the position can get profitable right out of the gate, though a rip-roaring bull will not come soon. First the stock has to bottom, like we might be seeing now, then it gets a decent rally into the moving averages or some trendlines where it will take time to get through them, and trade solidly above. Only then do momentum and trend traders come into the stock, and we get a smoother and more significant ride higher. However, if Vale can pay some dividends to me while I wait, and I can be up 15-20% on the position quickly, I don’t mind buying earlier than I normally would. I haven’t decided to buy yet, and since its Friday before a long holiday, I will not buy until next week if I decide to get involved. Here are the monthly and weekly charts, the monthly goes back twenty years, and both show stochastics in oversold territory.
I tend to agree with Patrick Karim that horizontal trend lines are most important. The weekly chart of SILJ is mine, but I suggest you follow the link to Mr. Karim’s fine work as well, it looks like the $31 level on the silver yearly chart going back to 1970 is a very important area. Above $31 is a massive breakout, no matter when the metal closes there. Could it happen by December 31st? Sure, its already there and just needs to hold, or go higher. Recall that we are in the strongest season of the year for gold and silver.
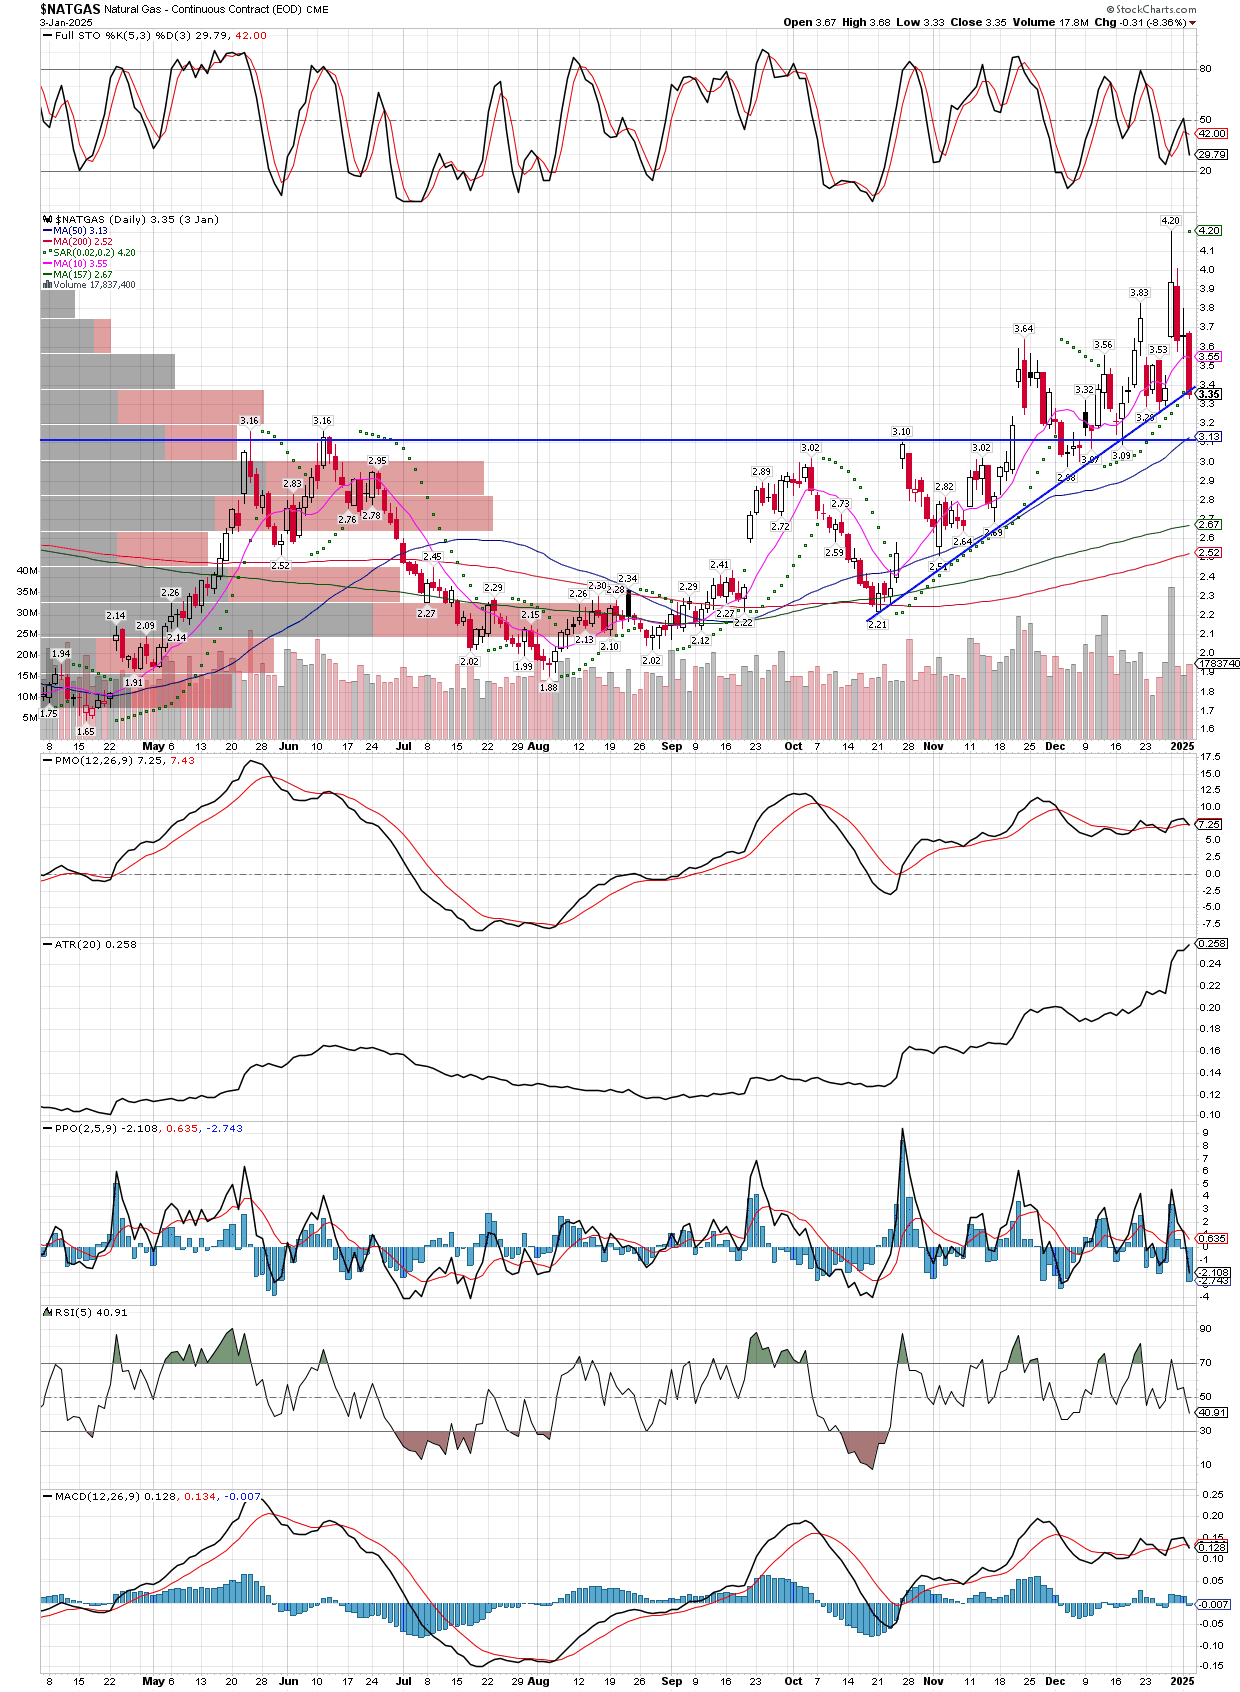
We started a position in natural gas (March contract) late last week at $3.015, and will look to add to the position. Basically, after natgas has a huge +20% day recently, it broke the downtrend, and while I don’t expect it will head immediately higher with the velocity we have seen, it appears that this commodity might have transitioned to a bull market again. Stops are down around $2.80, give or take a few pennies.
I’m also keeping my eye on agriculture stocks like NTR, and the futures in both Corn and Wheat. I have not gotten involved as yet, but its possible these commodities are about to transition back to bull status as well, after a correction lasting nearly two years.
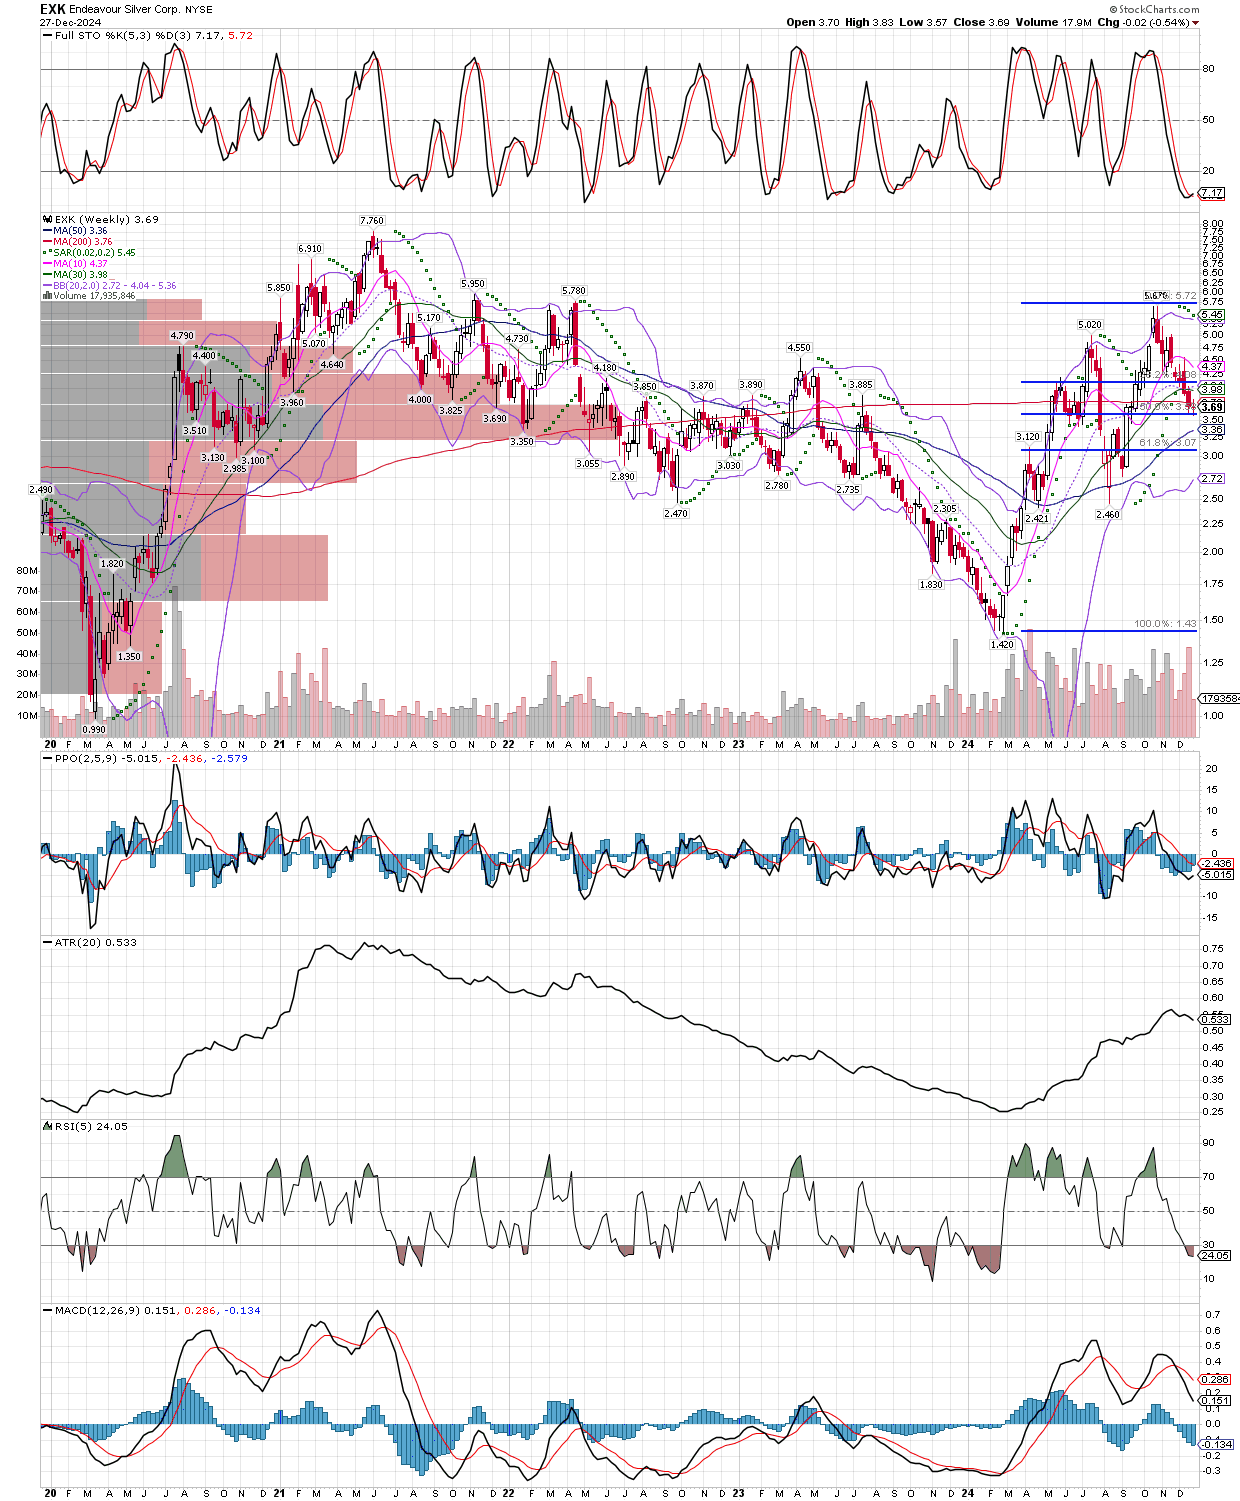
Let’s step back to the weekly (intermediate) time frame, and look at EXK. As the fifth largest holding in SILJ, this looks attractive to me since it has well-oversold stochastics, along with having completed a 50% fibonacci retracement. This is as good a time as any to get long, for those looking to add or start a position, or one could buy SILJ, since many charts in the etf look similar.
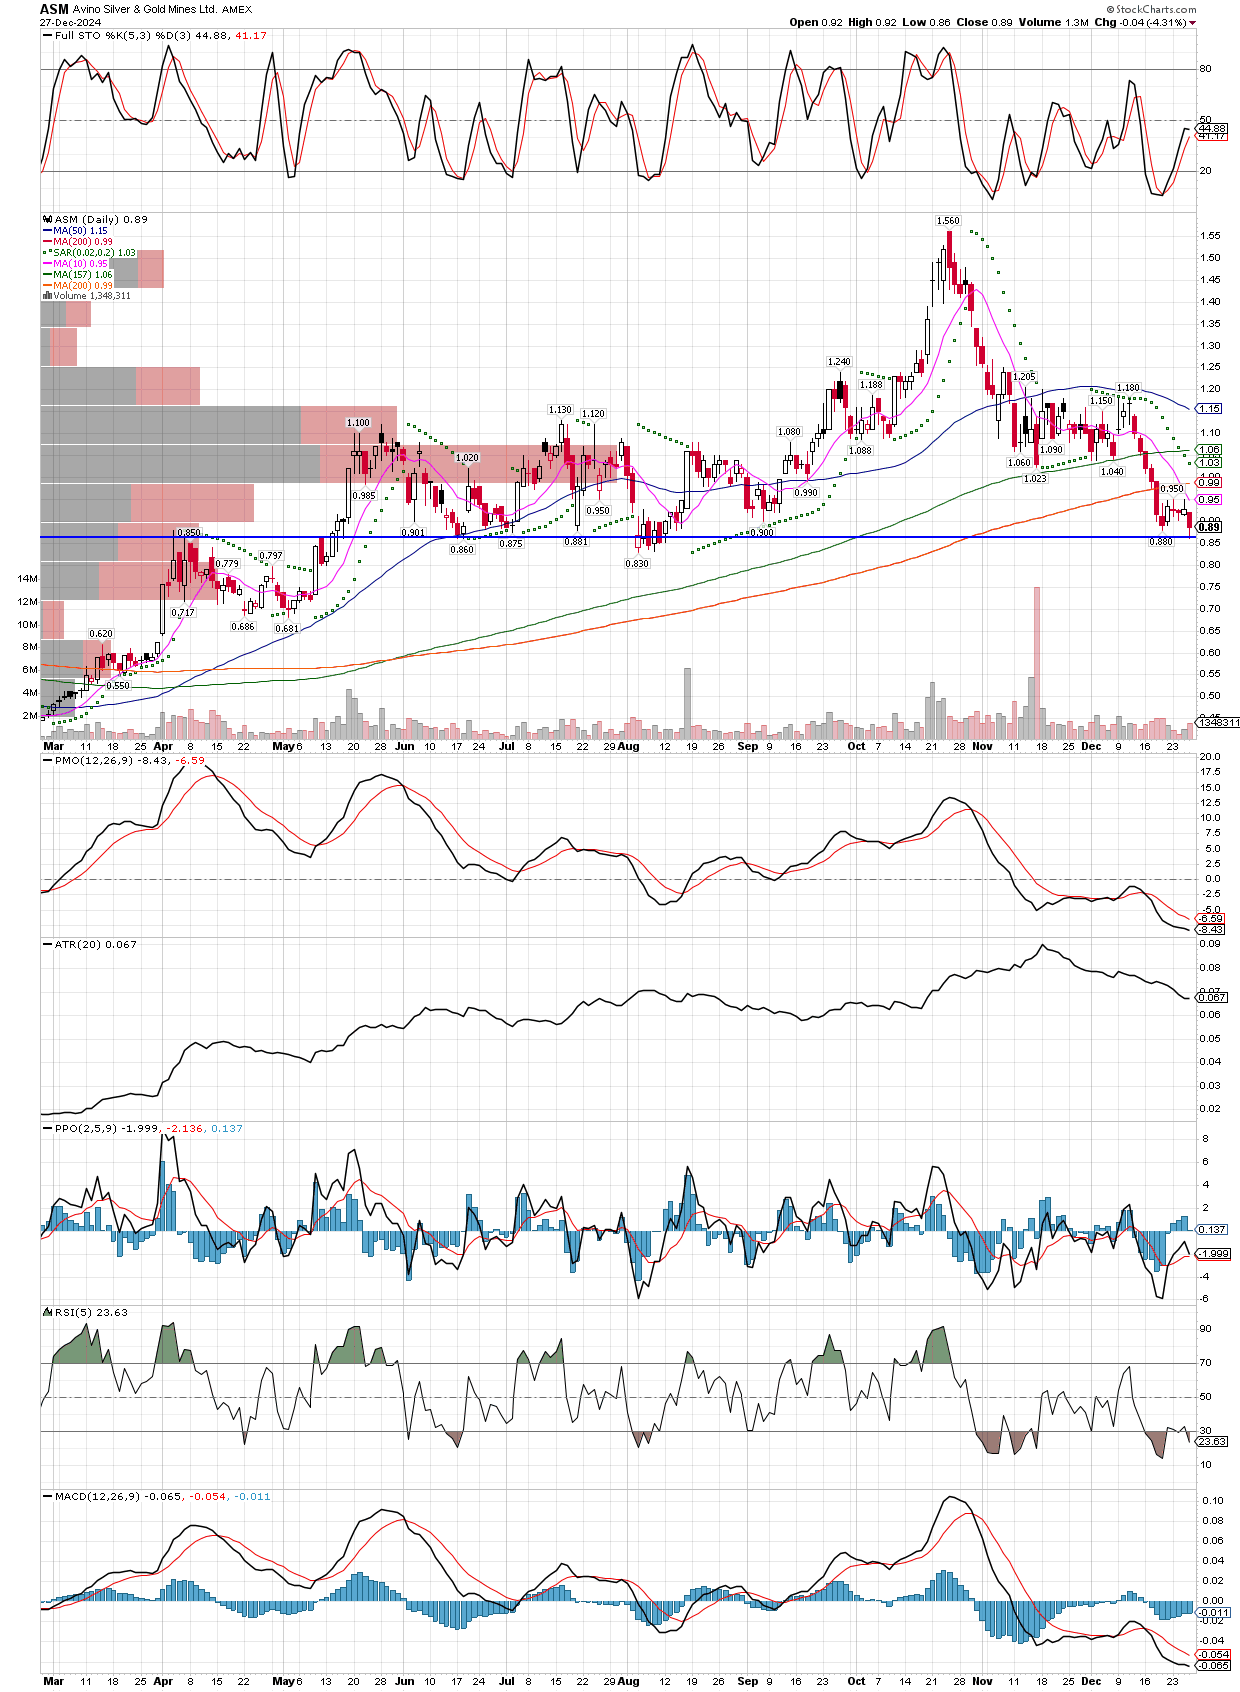
Tax-loss selling in the junior miners has been brutal this year. Take a look at ASM (Avino Silver and Gold Mines), after breaking into significant new highs in late October, it’s gotten smashed 44% lower in just the last 8 weeks! This is one I bought today, along with CHPGF (Chesapeake Gold), and a few others. I will take them off the hands of those that can’t take anymore!
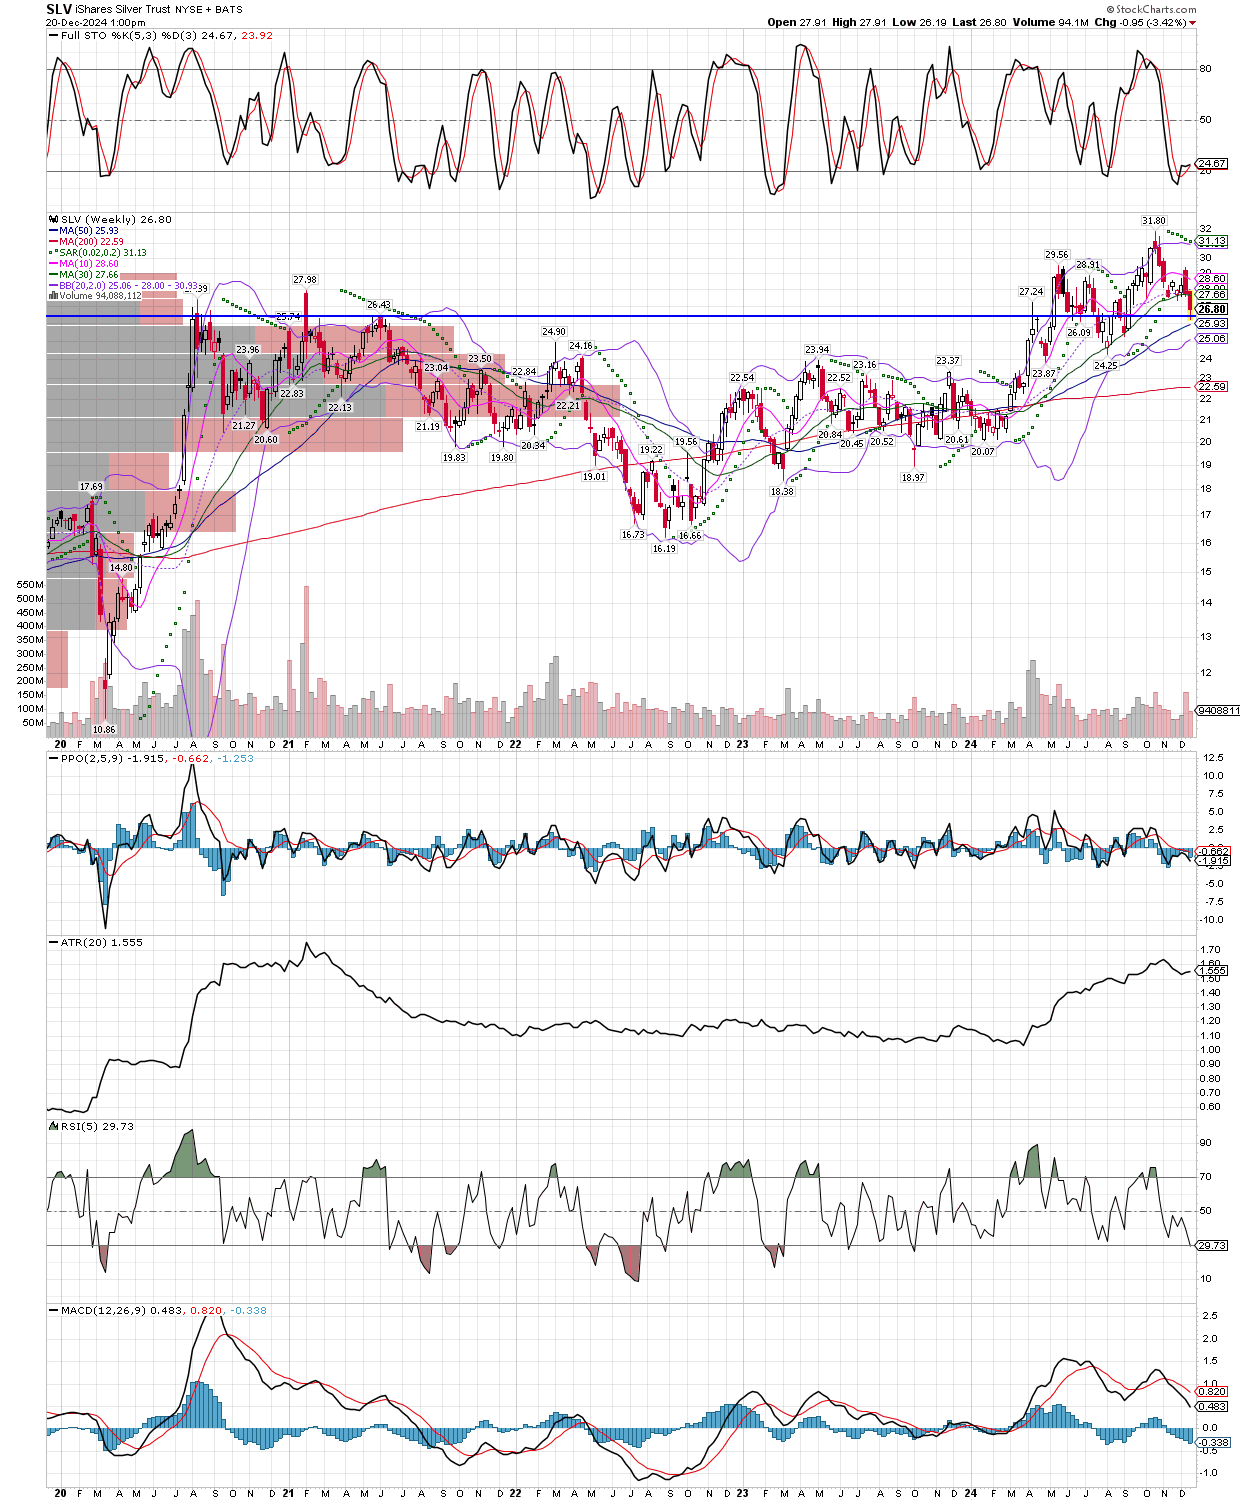
I will use the weekly chart of the SLV etf for a proxy on silver, with a quick horizontal trend line added, to show why I am adding to our Silver futures (March contract) position today if we get over the $30.09 level. That level if taken out on the upside, would suggest the move lower this week was a false breakdown. Thus far, Silver has managed to get up to $30.03, so we are getting very close. I will add 20% to the current position size.
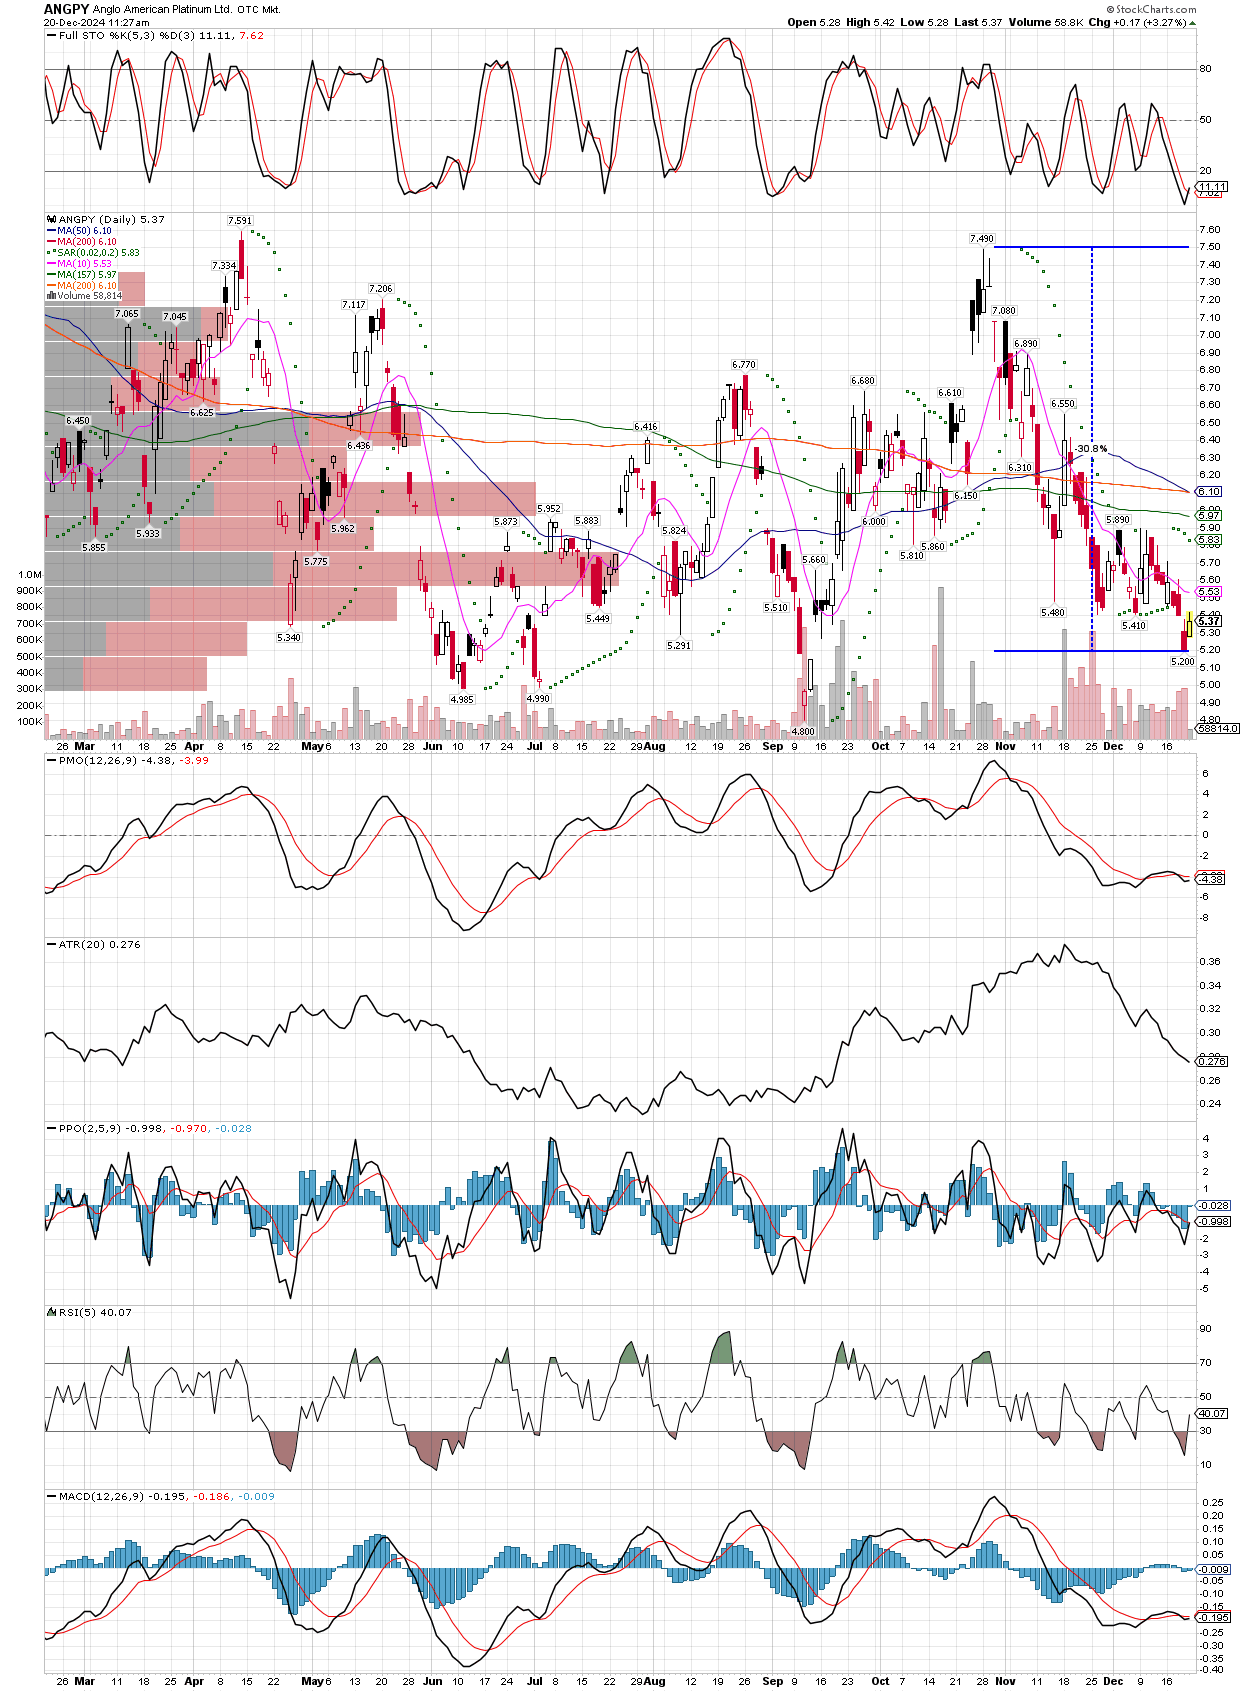
There are so many miners with similar charts, I only use this one of symbol ANGPY since I was buying it today at $5.35 per share. Its the world’s largest platinum miner, and pays a dividend of 3.3%. Apparently its a favorite stock of Jim Grant from the Interest Rate Observer, I read recently. Like I said, there are many, many miners including the SILJ etf itself that are down 30% off recent highs just made in October, so I will continue adding to positions here since we are still up nicely overall. Having a good cushion of unrealized gains makes it easier to stay calm in corrections like this, so that we can buy or add to positions versus being scared out of positions, the opposite of what we want to do.
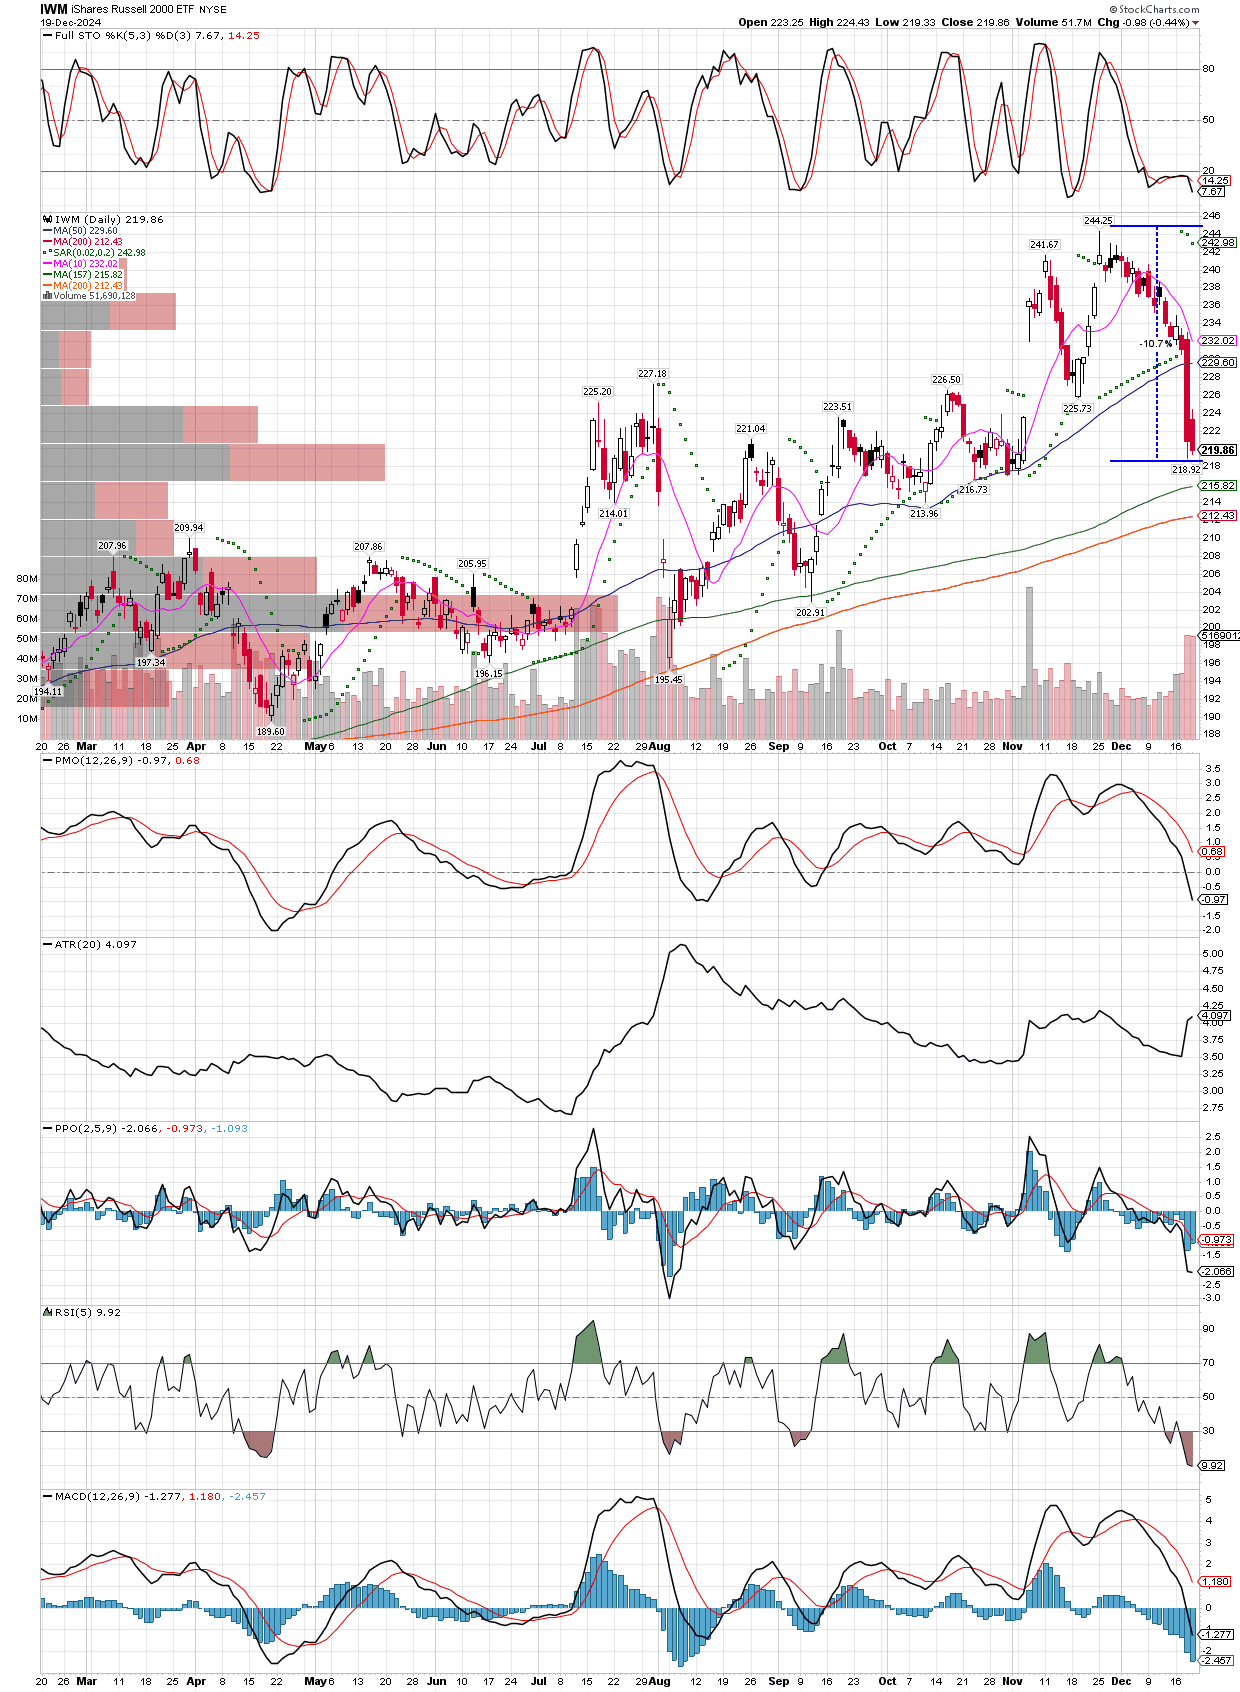
The Russell 2000 etf by symbol IWM is already down 10.8% from its all time highs made in late November, less than a month ago. We also see groups like biotechs, solar, and financials (KBE) making new correction lows. So the question is, how much downside will they see, and with crypto junk also crashing, will some of the money leaving these overbought areas find its way into gold, silver and the miners? Stay tuned!
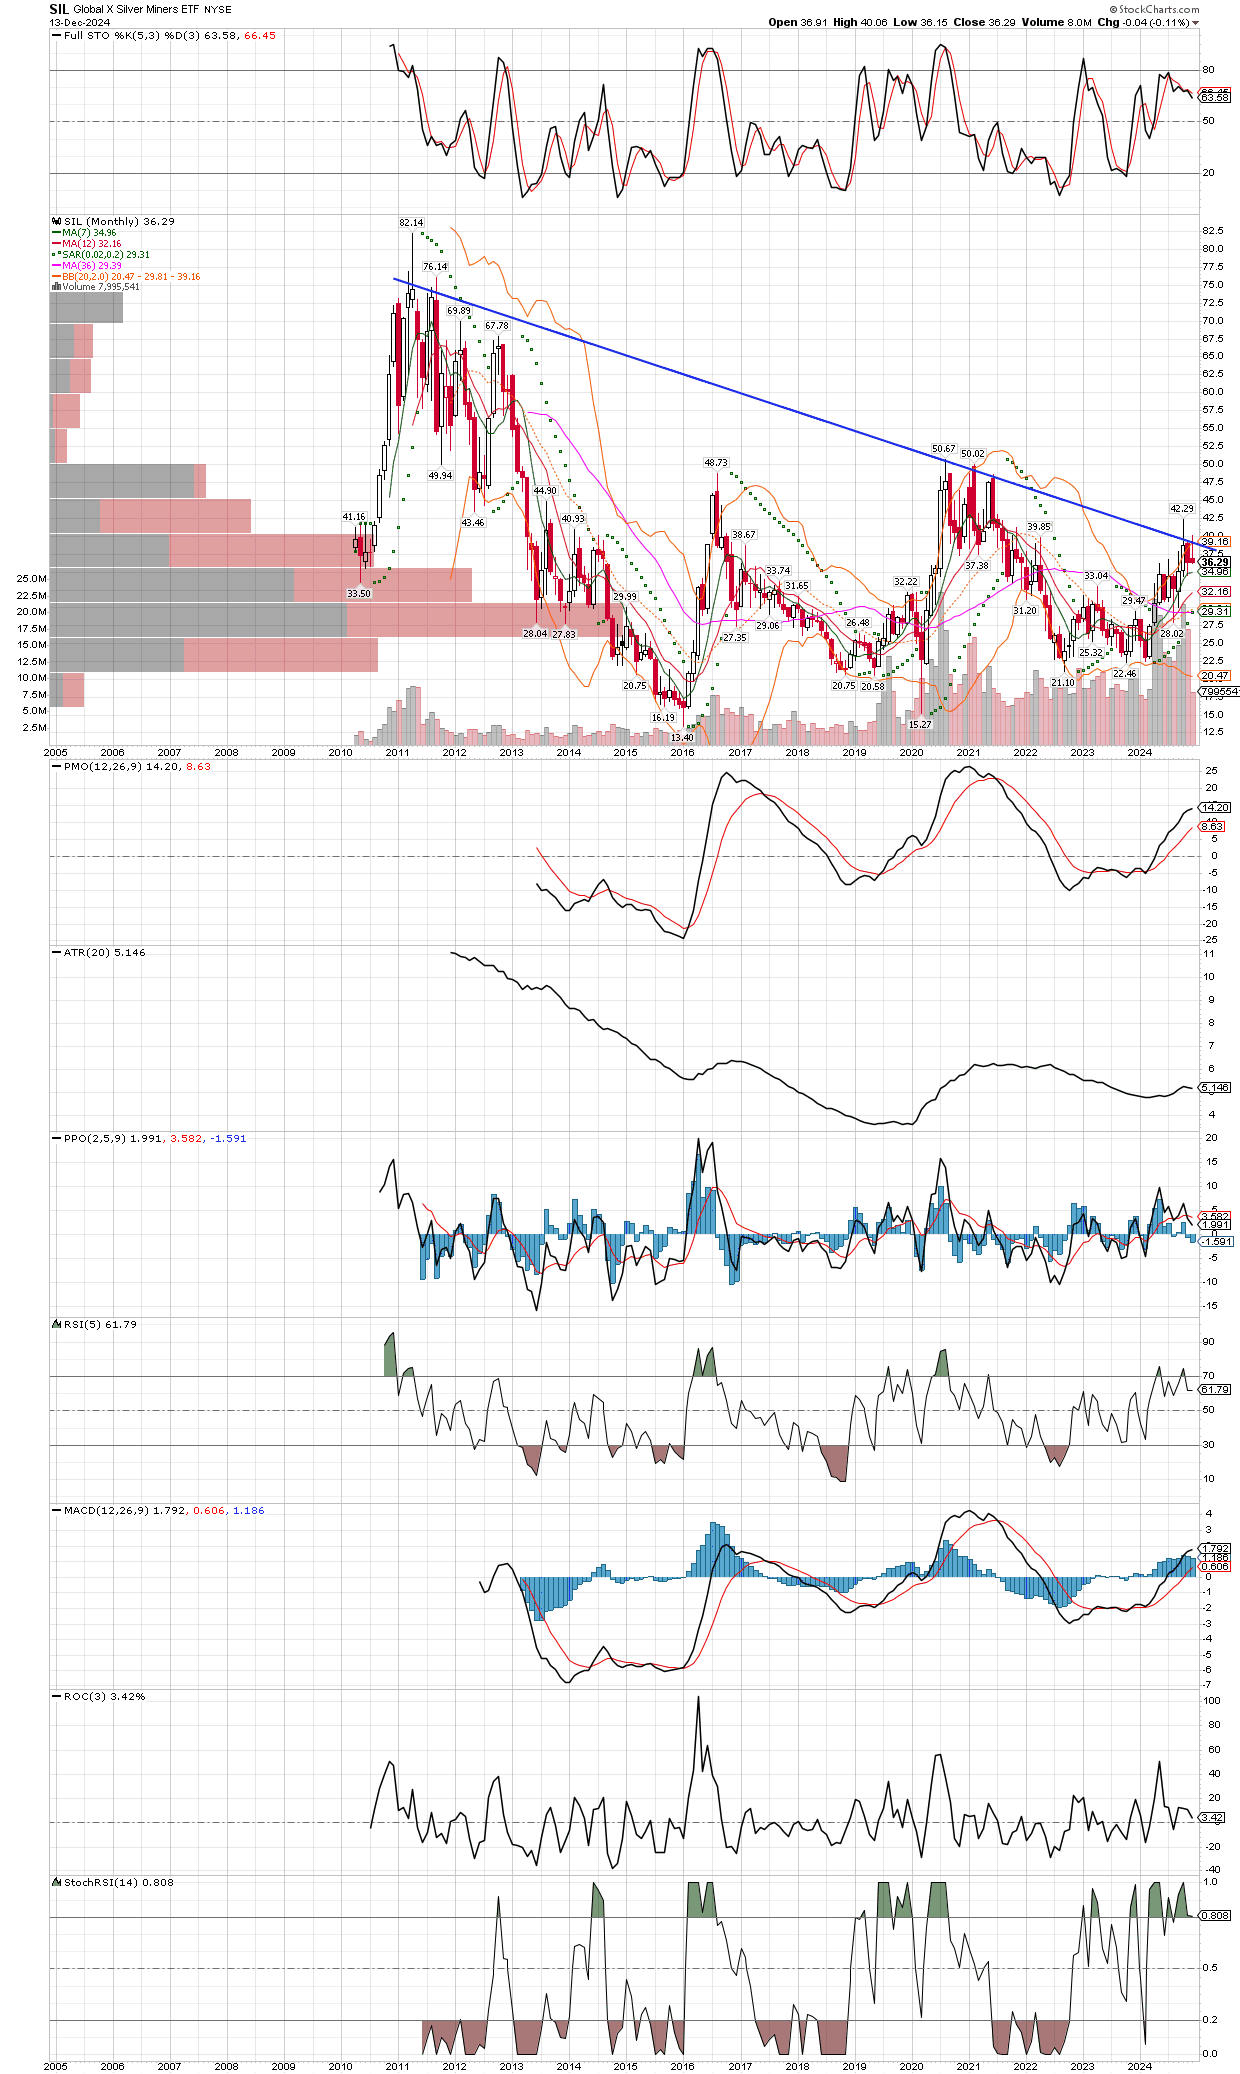
We are currently pulling back in the metals and miners, just ahead of the best time of the year seasonally, for the group. Time to add into dips again, on oversold technicals on shorter time-frame charts like the weekly and daily setups. It looks like a monthly close over $39.50 or so might be enough to motivate the miners to make a massive bull run to the old highs in 2011.