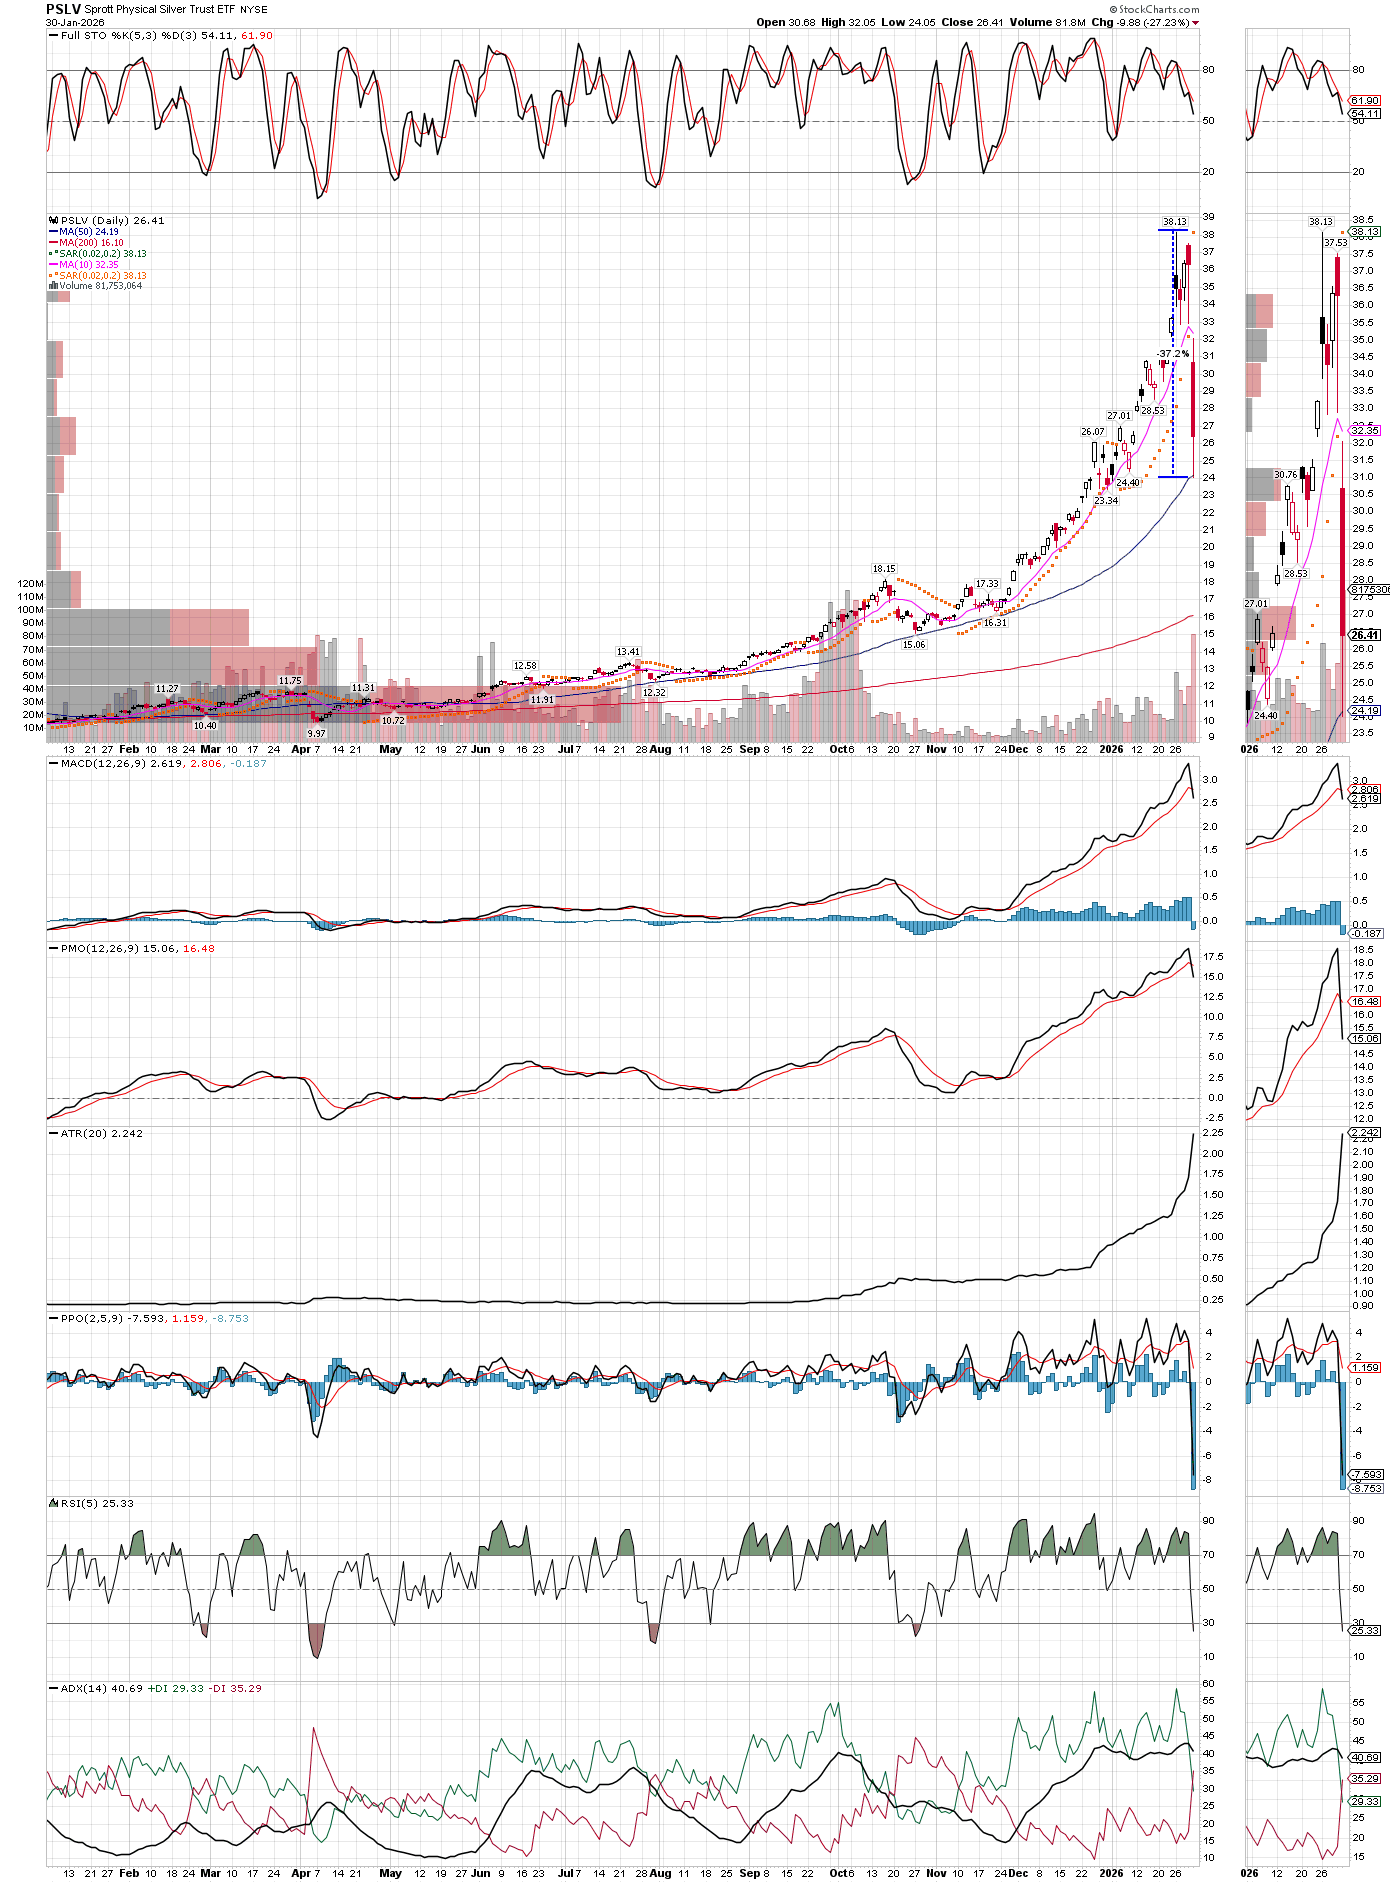
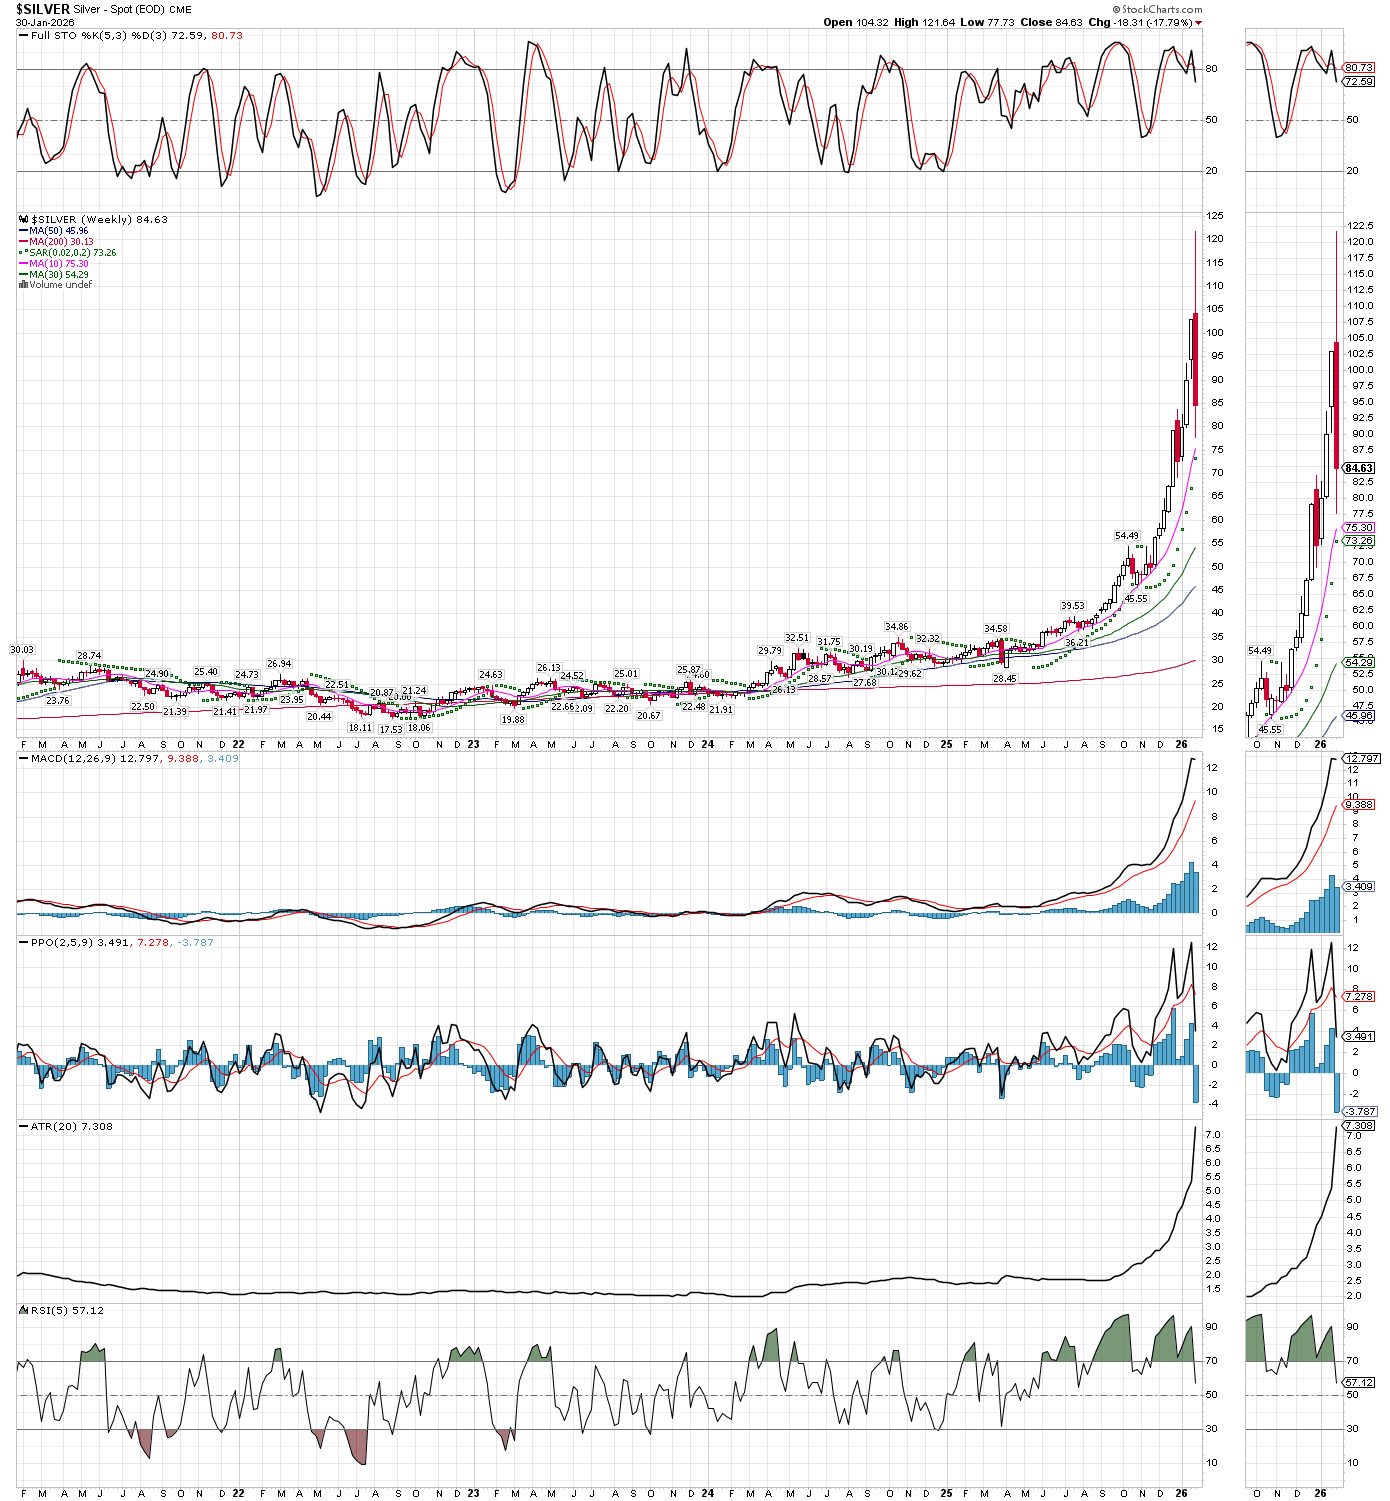
WOW! Silver From $50 To $120, then back to $80!
February 2, 2026
What a ride its been! I have been busy lately, selling over 60% of our holdings, into the biggest spike in silver in history. We were fortunate to be selling all last week, just in front of the worst clobbering in silver’s history. Absolutely insane action, so I don’t have much time to write here today, just a quick update, and the charts to show the action. There is too much to talk about, like PSLV’s near-record discount to NAV, suggesting this bull market is far from over, as well as how I think this correction might play out, though its already pulled back enough in price that I am interested, but not enough time has passed. We need time for technicals to reset, for the biggest potential gains to resume, but with such a drastic pullback, it also would not surprise me to see silver trade back up to the highs soon, either. In any case, I do plan to add back shares in miners and PSLV, along with the SLVR and maybe SILJ etf, and will be happy to post here when I do. Its been a spectacular run and we have made a fortune, some of our LEAPS are up over 20x, most are up over 10x, as well as many miners’ shares up 7x-10x, truly remarkable gains in less than a year!
Historical moves are being made almost daily now. We still have just under 40% of our precious metals and miners holdings, heavily skewed to the miners now, since there are catalysts to help miners outperform over the next several months, such as blowout earnings reports starting next week, and even bigger upside surprises expected for next quarter’s results (Q1). The bull isn’t over, and sharp, scary corrections are a tell-tale sign that there is more upside to come. Media is now full of people forecasting silver at $200-$500 before the bull is over, a sign of short-term froth in the market, though they will likely be proven correct as this silver bull has already broke several records when compared to all past bull markets in the metal. Even gold, which has dropped 16% from its high already, in just a few days, still had its best monthly gain in the last 100 years, including the beating it took on the last day of January to close the month. The daily chart looks ugly, while stepping back to the weekly or monthly, one can barely see the weakness.