Seven Straight Weeks Higher For Miners
September 20, 2025
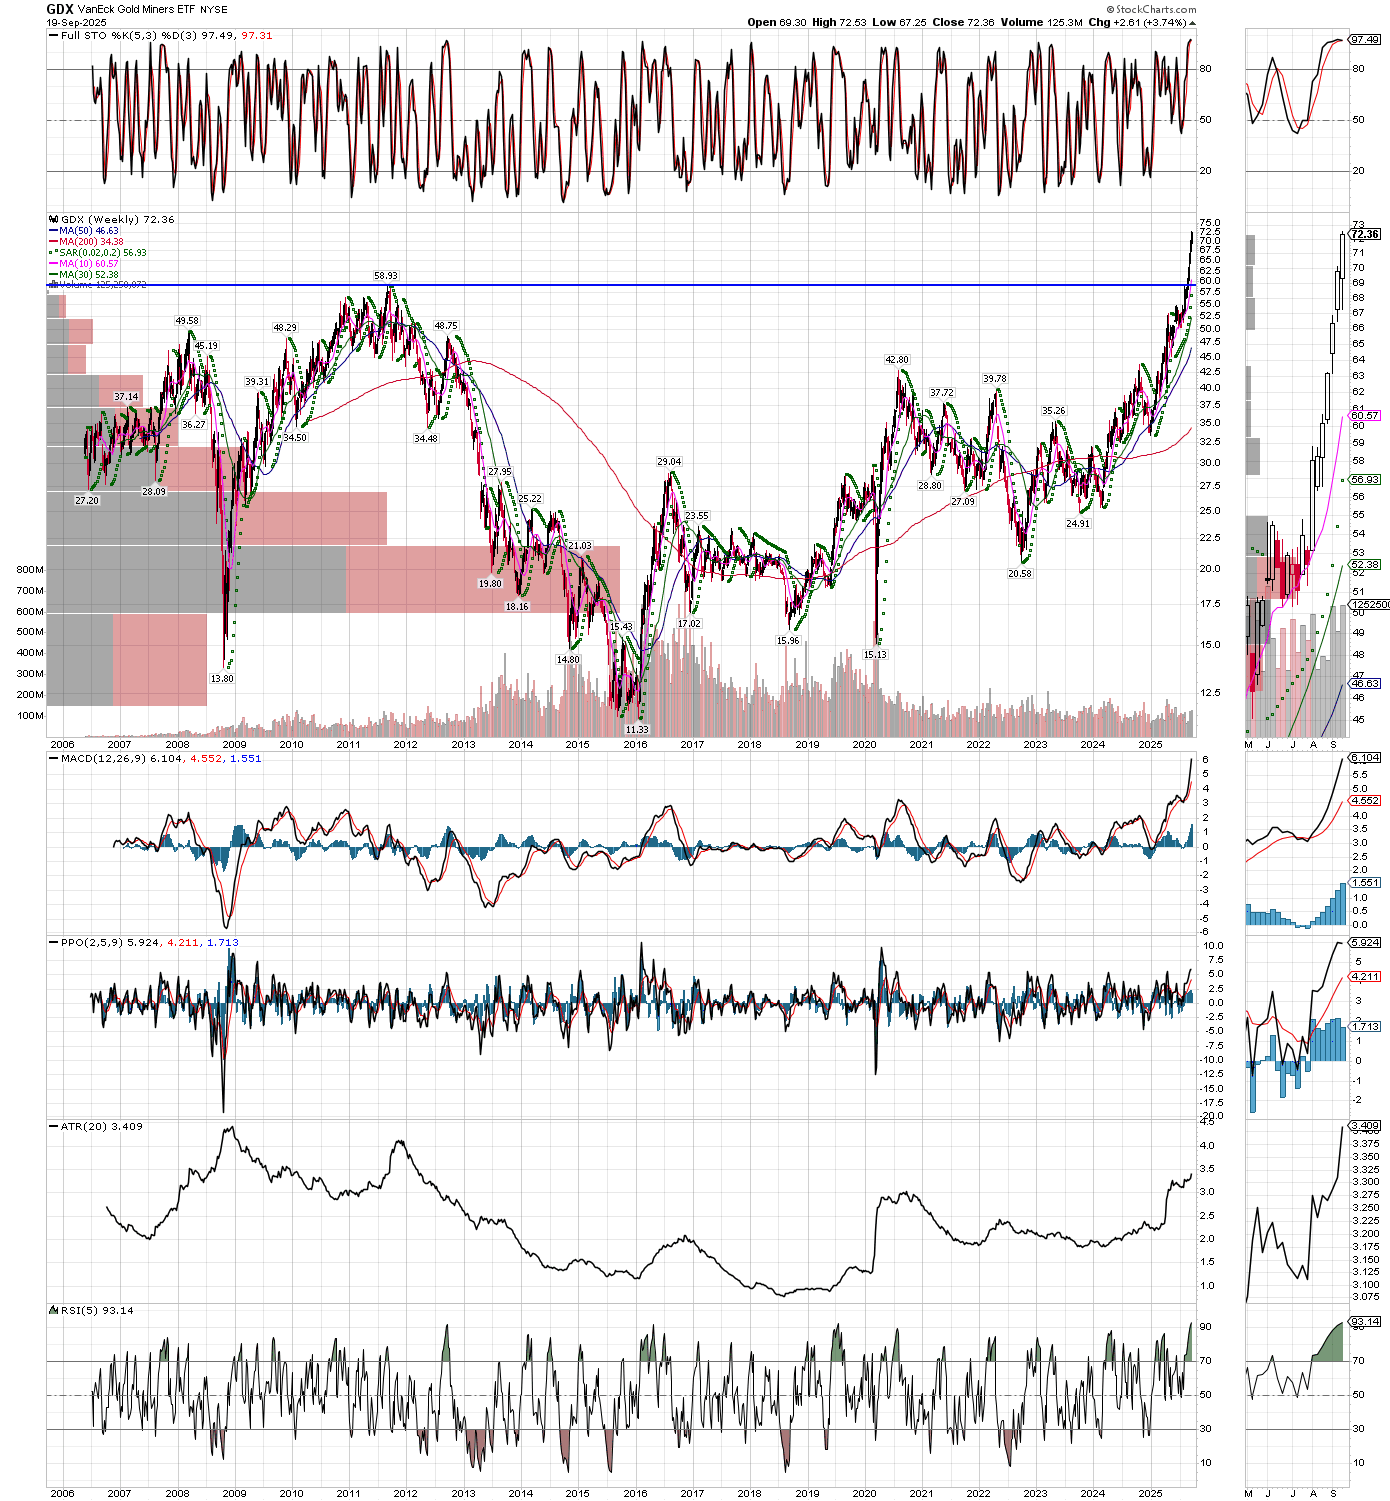
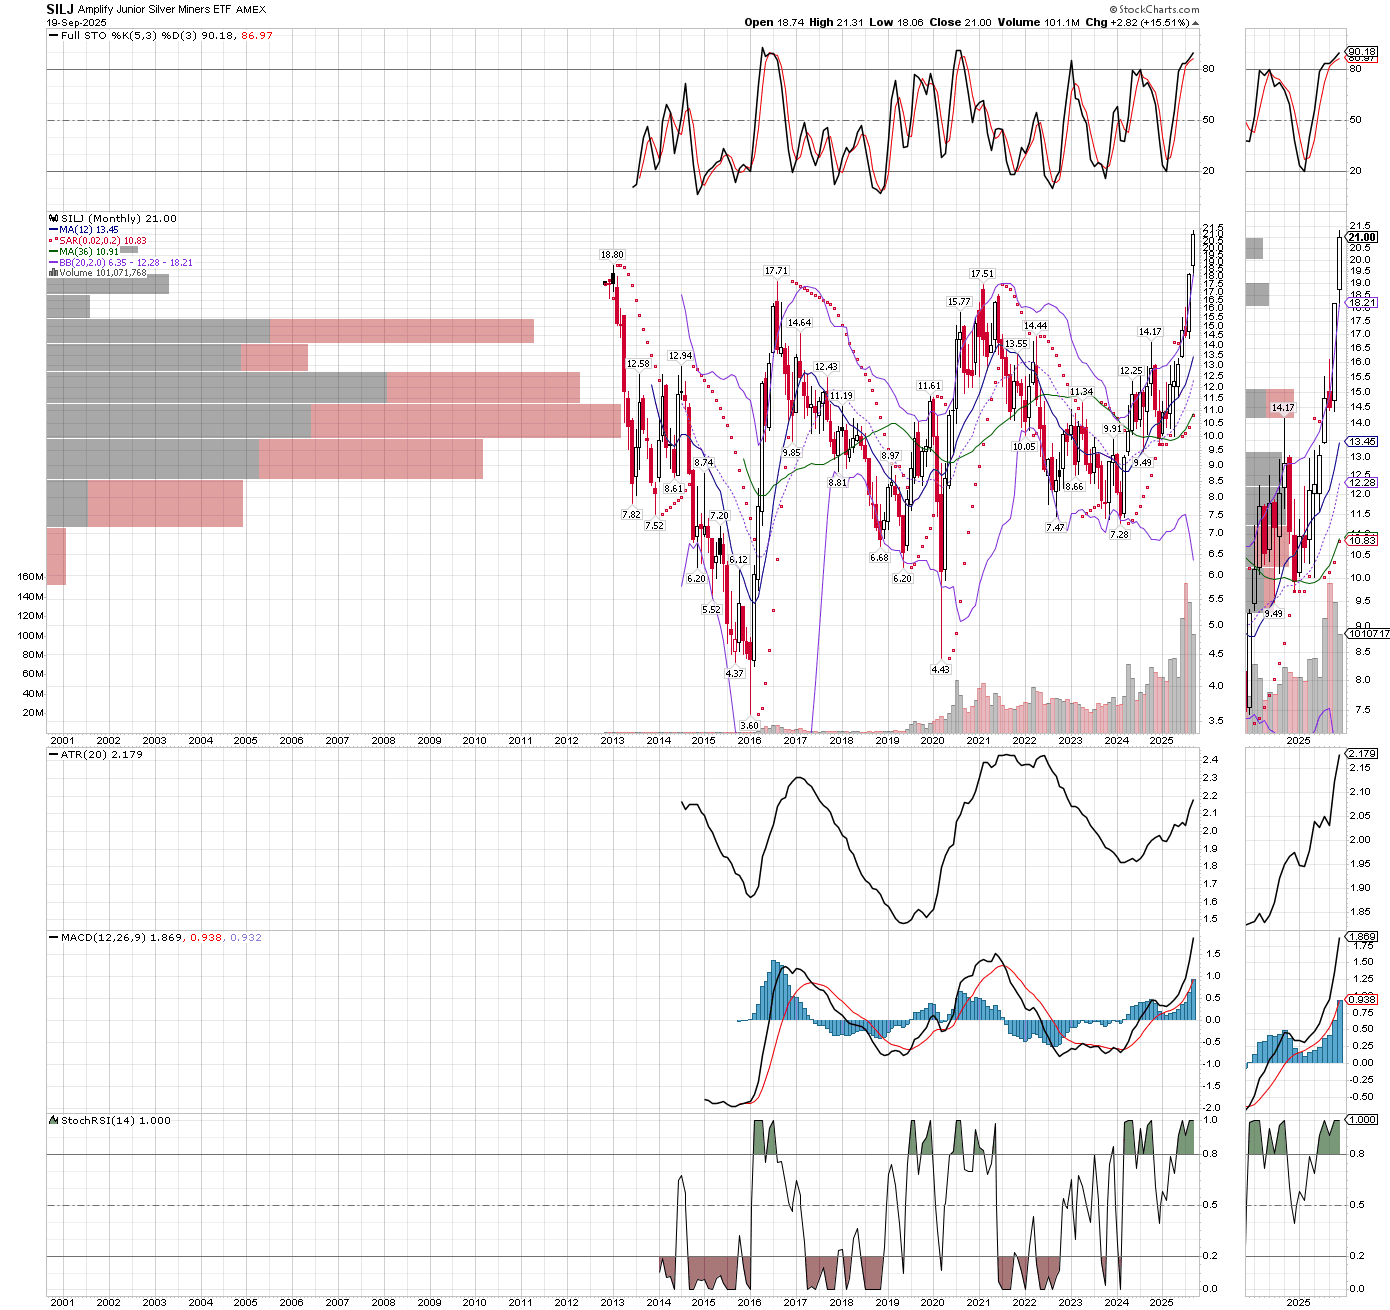
The GDX chart below is a weekly chart going back twenty years, just to show how definitively the miners have taken out the all-time highs. Look to the right side of the chart to see the last seven weeks close up, its a rip-snorting bull market! I also posted a monthly chart of SILJ, also trading in all time high territory. This bull is real and has legs, that is VERY strong momentum!
While miners are clearly overbought, and a correction could occur at any time, the right move has been to stay heavily long. If we get a correction, say if GDX can pull back to its previous all time highs, it is a screaming buy opportunity. However, since momentum is so strong at the moment, we not only might not get the pullback until we see higher prices first, we also might not get a deep pullback. Our portfolios are up huge at the moment with unrealized gains, several holdings are up 400-600% already, so the temptation to ring the register is great here, but my system has told me to stay long and that has paid off nicely thus far. When I get a signal to sell, I will only trim around 33%, as new all-time highs are a sure sign the miners and metals are going much higher before the bull is over. I would also look to put those funds from any sales I might do, back into the group on the pullback if it materializes. I hope you are long and strong the miners, their time has come!