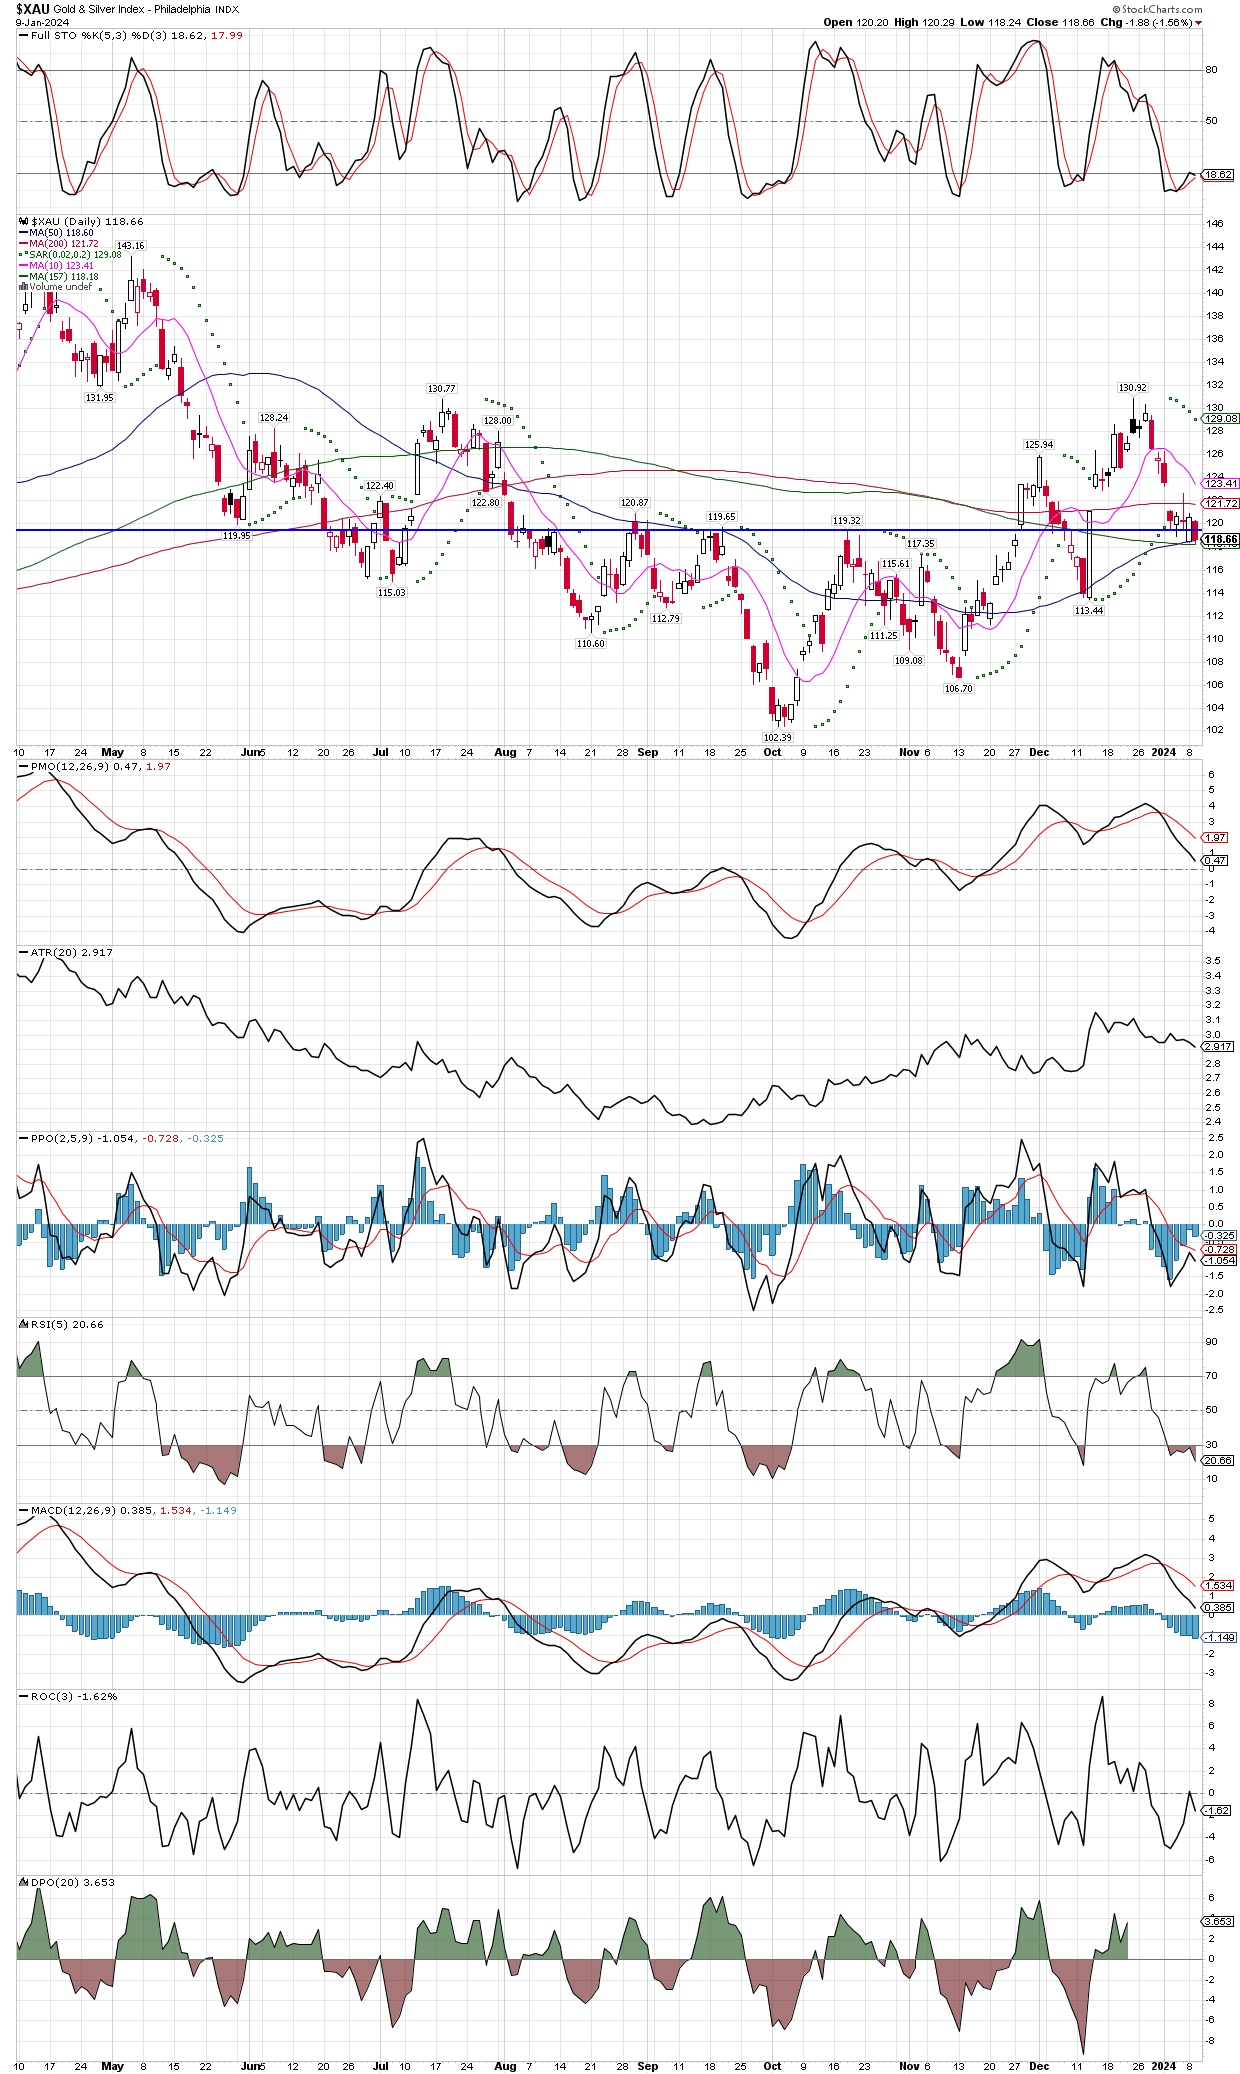
XAU Index Daily Chart
January 9, 2024
Since I typically focus on long term charts, here is a chart of the XAU daily going back nine months. I quickly drew the horizontal trend line since it jumped out at me, that this might be a good area to buy/add and get on board the bull market.