Added to my CDE and SILJ
June 6, 2022
Took advantage of today’s dip to add to LEAP call options in CDE and SILJ. These expire in January 2024, with a strike price for the CDE options at $10, and for SILJ we bought both the $14 and $15 strikes.
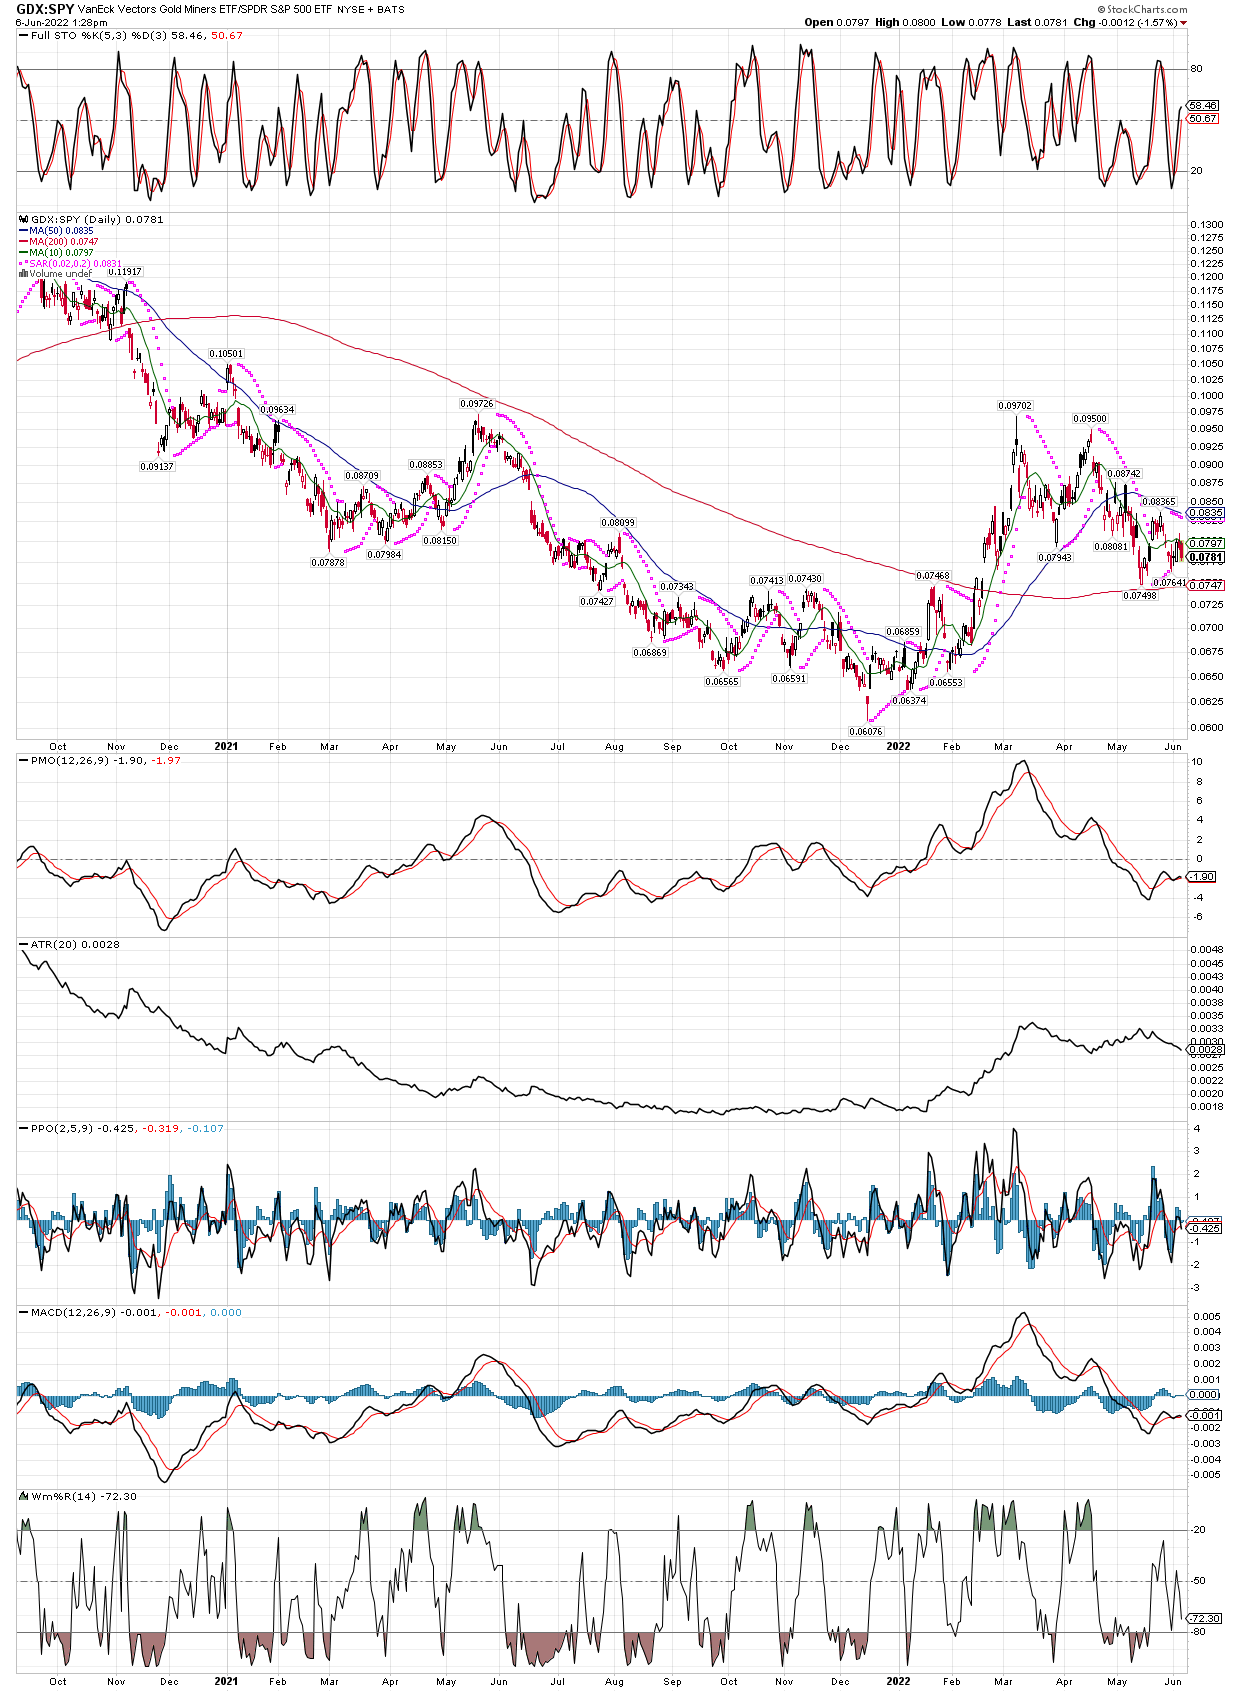
Today, lets take a look at some ratio charts, as they show us what something is doing versus another. First we see on the daily GDX:SPY chart that the trend in outperformance of of the stock market over gold miners looks to have changed. The ratio remains above the 200 day MA, which is also gently starting an uptrend.
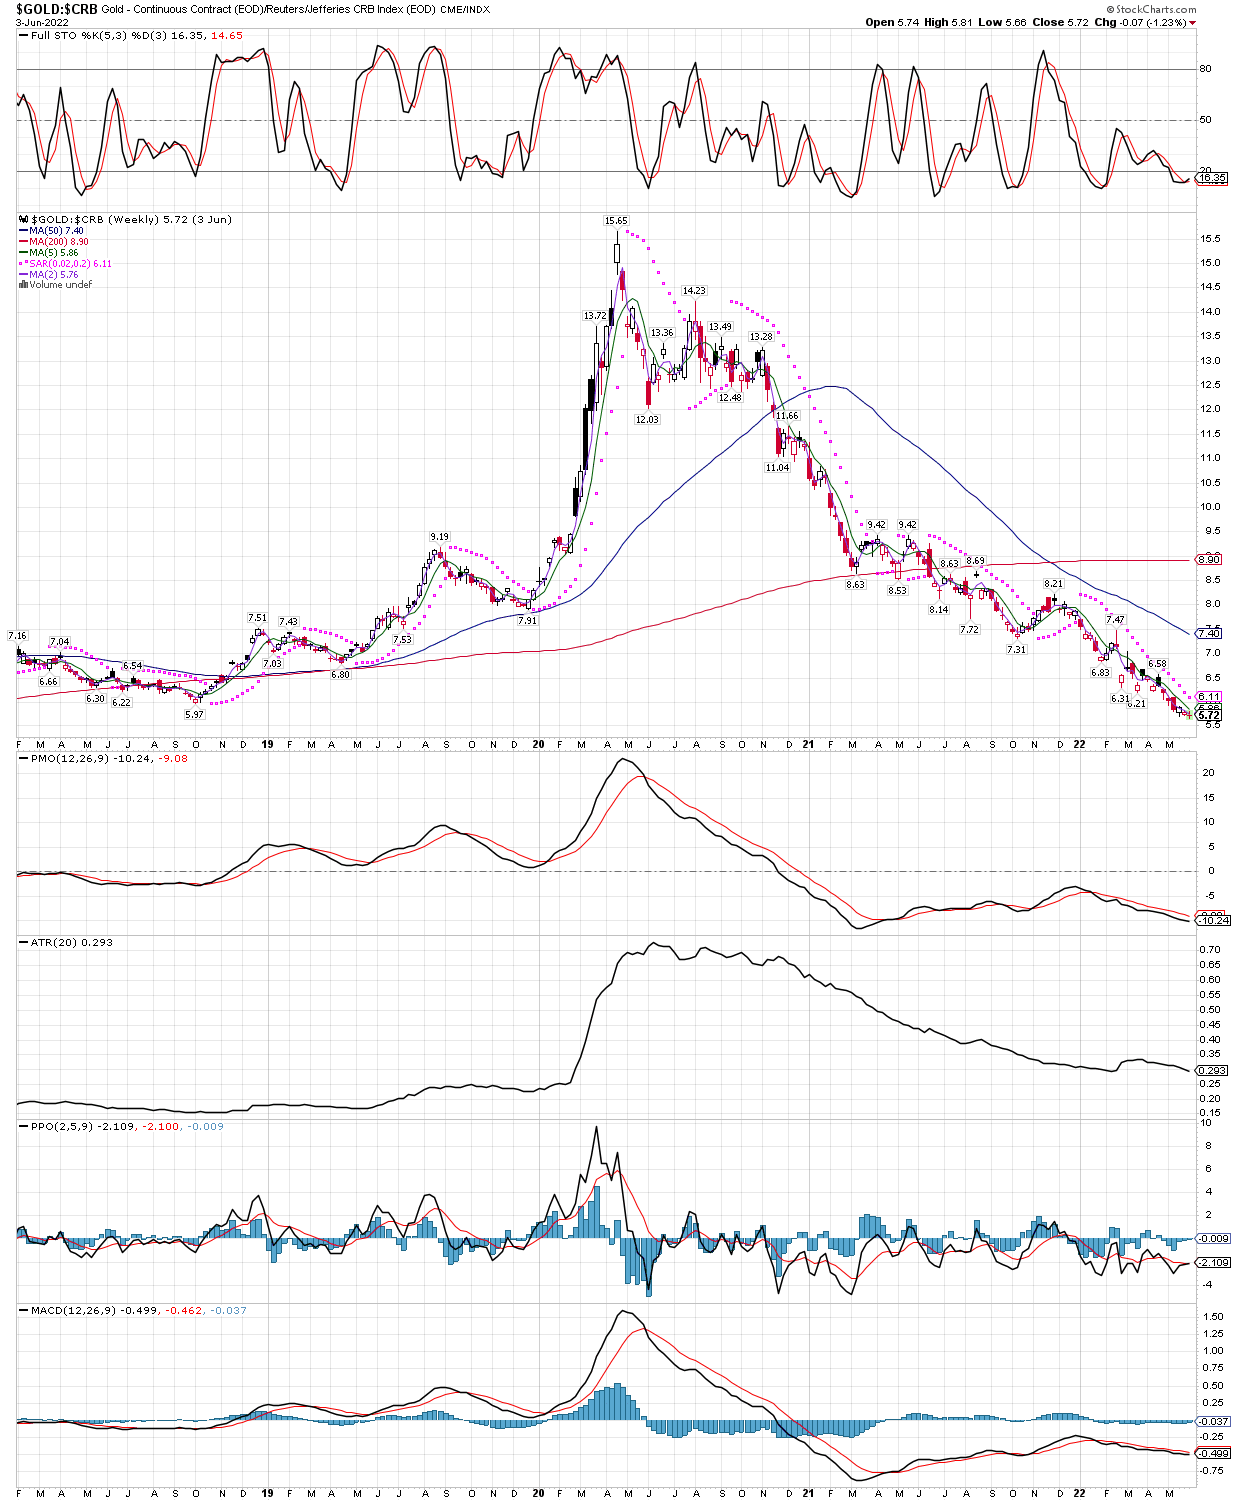
In the second chart, please note I changed it to a weekly setting, so as to get a longer term view. In this one we see the gold futures vs the CRB index, $GOLD vs. $CRB. I am not a huge fan of the CRB as an overall representation of the commodity sector, with weightings of Energy: 39%, Agriculture: 41%, Precious Metals: 7%, Base/Industrial Metals: 13%, but since precious metals are such a small part of the index at 7%, it makes for a better comparison between gold and the group in general. As you can see, gold has been underperforming the other commodities since around the middle of April 2020. However, the ratio is deeply oversold on many technicals such as stochastics, and since the nature of ratios is to normalize over time, we should expect to see either the energy, agriculture, etc come down in price, or gold to rise, or both. And if things like natural gas and oil continue to smash into new highs, that should bring gold higher as well.