Uncategorized

URNM

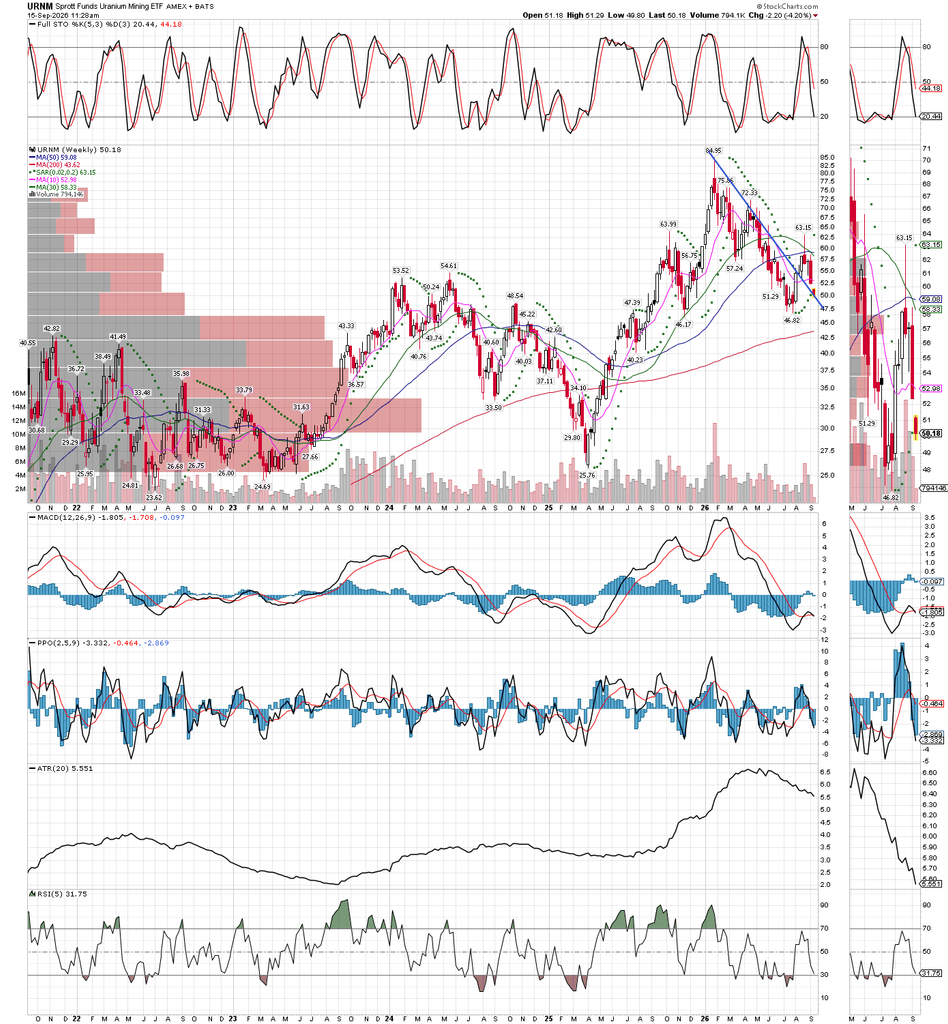
I have orders outstanding to sell near term puts on URNM (Sprott Uranium Miners), trying to take advantage of this pullback to acquire shares. The reason I am selling puts short, using out of the money strike prices, is that tomorrow is the FOMC announcement on rates, and while things are quiet now, we often see a spike in many markets once the news breaks. I don’t care what they do, the edge is in taking advantage of any spike lower in order to add to our long positions in uranium miners. If we get no orders filled on the options, I will cancel them, and add to our current uranium holdings, including CCJ, NXE, UEX, DNN, DYL.AX, and others, raising total risk on the group by 1%. Here is the weekly chart:

As always, my trendine are “loosely” drawn, not meant to be exact lines in the sand, more just general areas I see as favorable to take action. So far the uranium stocks have treated us well, so we can chalk the above intended purchases as “adding to a winner.”

Uncategorized

Platinum

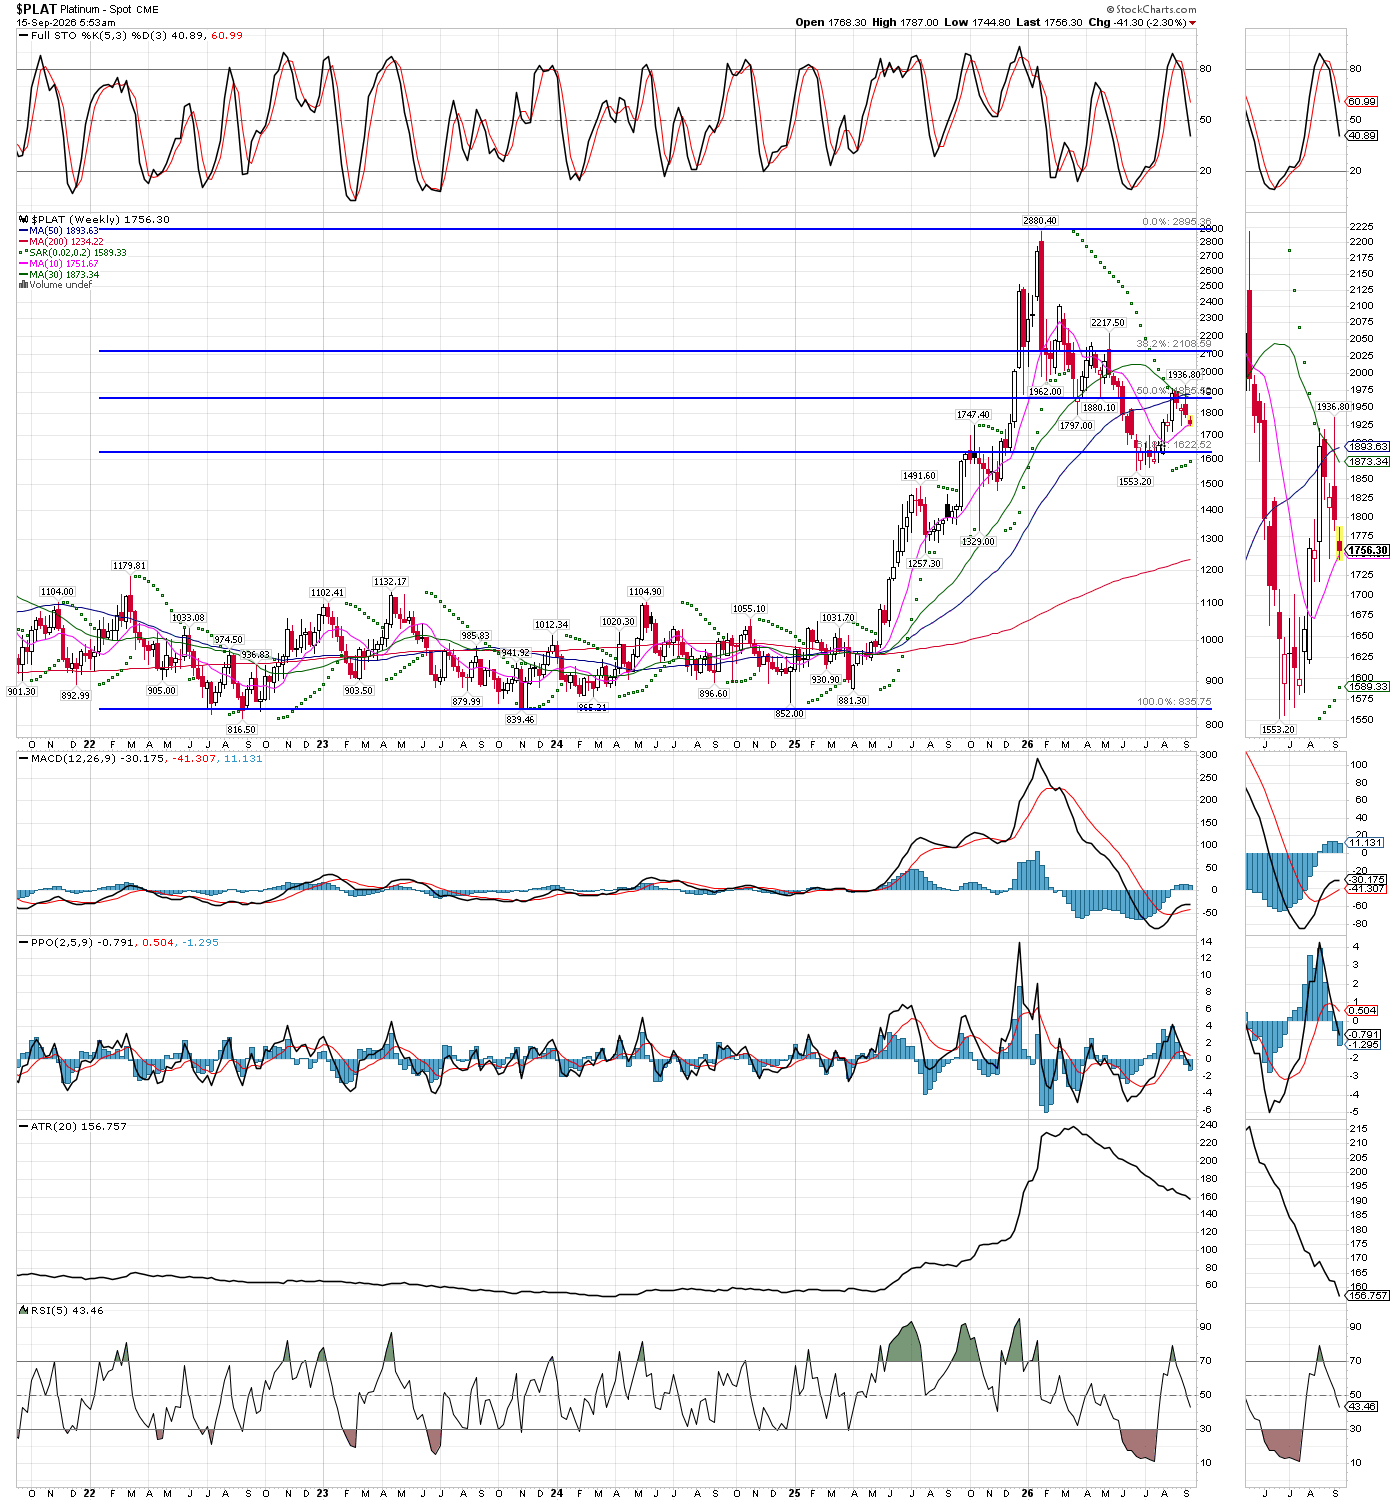
Platinum has had a significant pullback in its bull market, along with gold and silver, while copper reamins not too far from its all-time highs. The message is clear, be long metals and commodities, the only questions should be when to buy and how much (position sizing). Further, look at the forward dividend yields on stocks with rising dividends like Sibanye and Valterra, paying 6.80% and 5.70% respectively! This mid-September is a pullback that should be taken advantage of, to acquire many commodity stocks that are now paying substantial dividends that should rise further, as earnings and cash flow continue to grow. We are also waiting patiently to add to our Australian coal stocks, yielding in the 4-5% range, as well as to our first tranche of uranium stocks such as CCJ, NXE, UEC, UUUU, DNN, and others. Lastly, we didn’t get invested yet in many copper stocks because I suspected the economy would slow down faster than it has proven so far, but if big copper producers such as BHP, RIO, and BVN drop further, I will buy/add in that area, too.

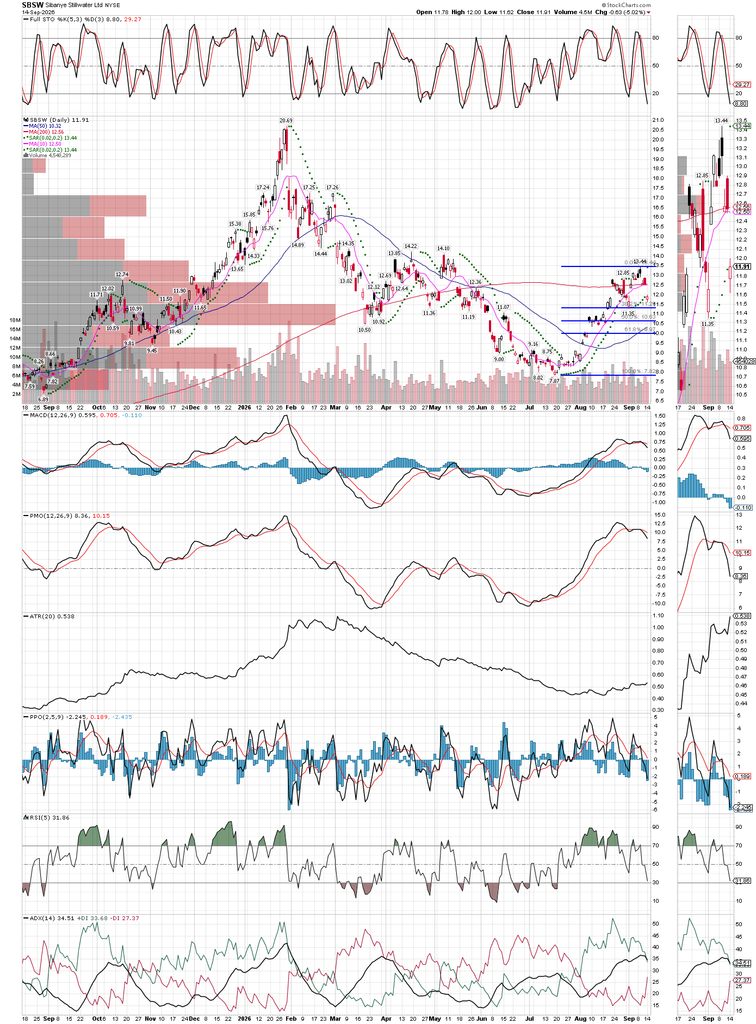
On a nearer-term daily chart, I might be early buying stocks like SBSW in the $11.50 area, we will see, but with a near 7% dividend, I can afford to wait for the return of the bull, which I am quite confident will occur.

Uncategorized

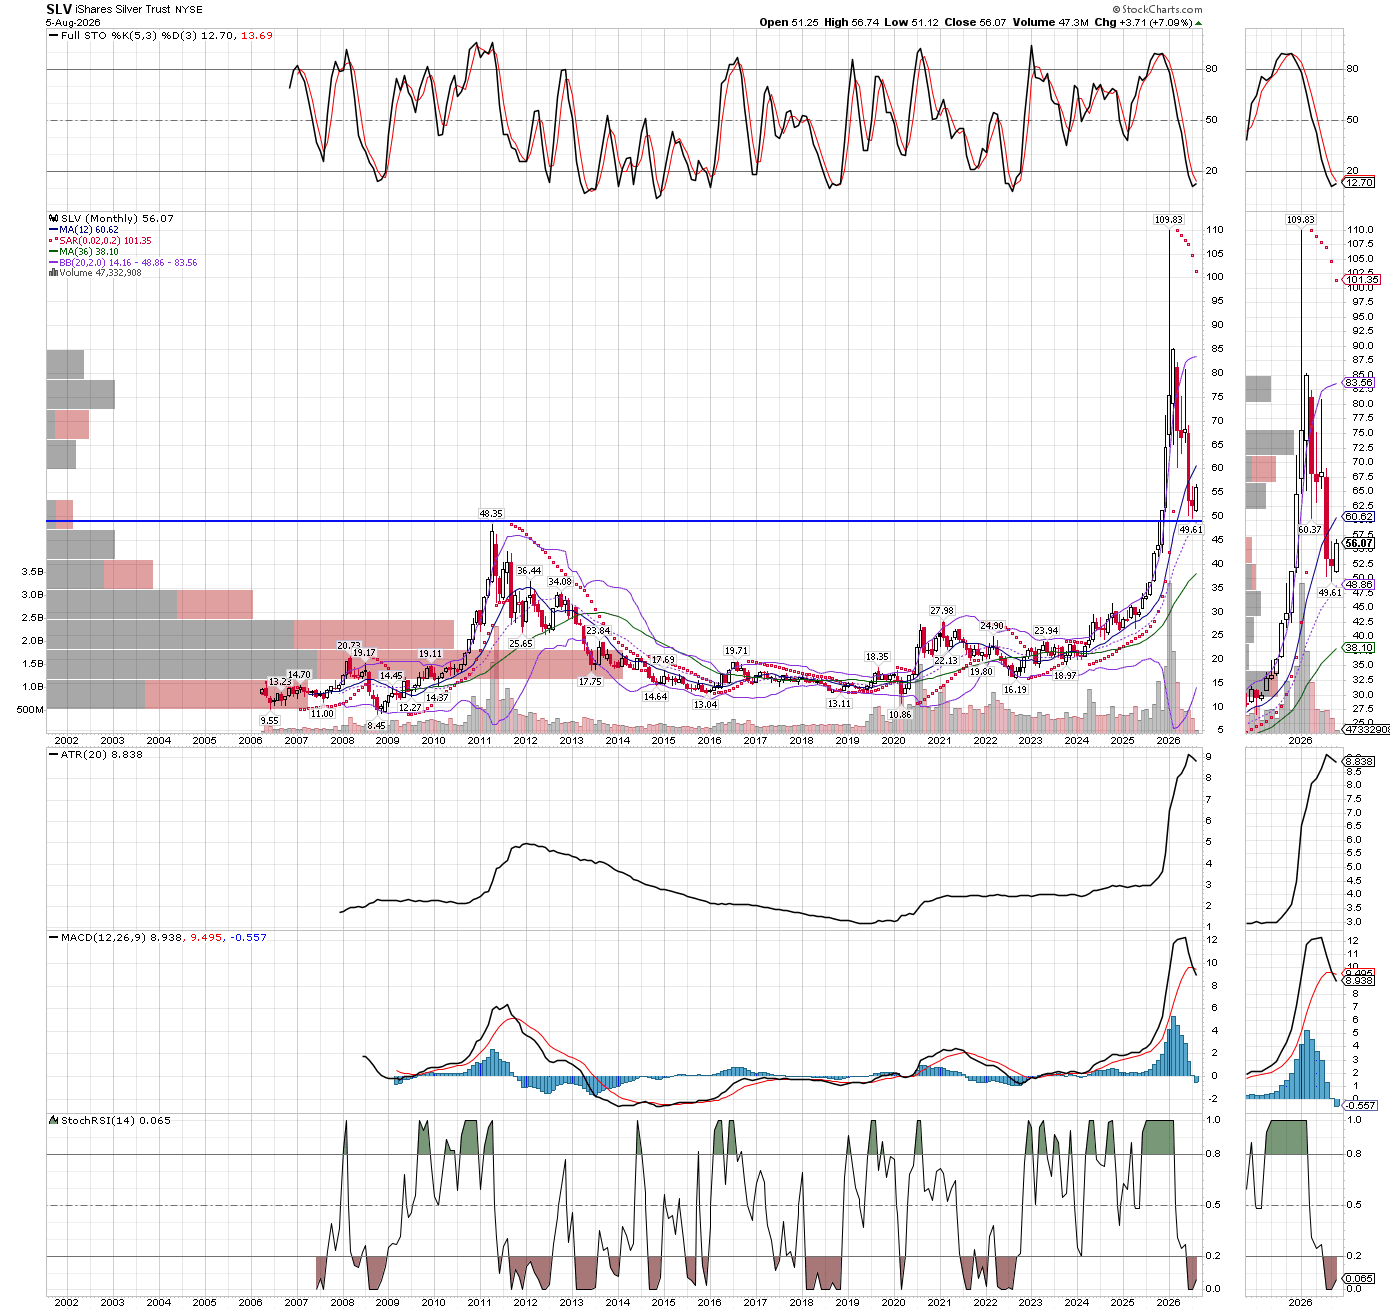
Silver Monthly Chart Says It’s Time to Buy Again

Sure it could go a little lower in the near term, but I would not bet on it, and if it does, I think it won’t stay there for long. We tend to get too caught up in the near term, day to day moves and news, looking at a monthly chart forces us to sit back and see the big picture, clearly lots of upside potential vs. not much downside.

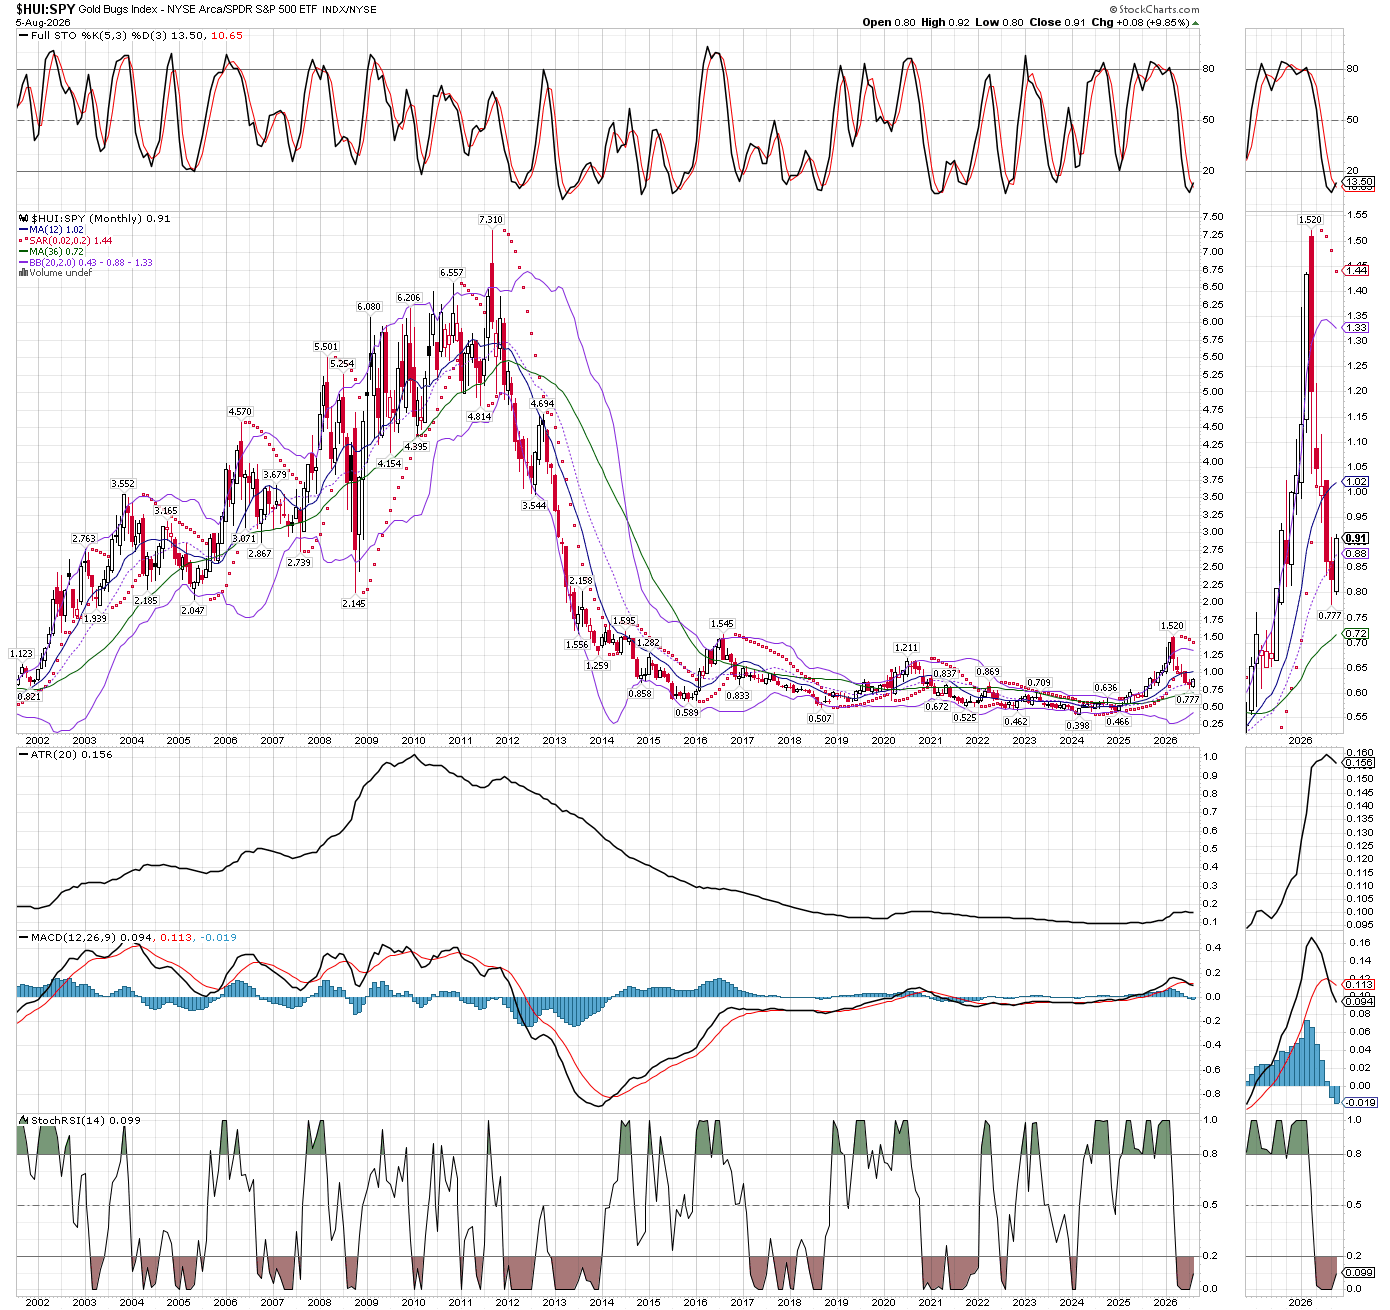
And since the miners are the leveraged way to play the metals, and they have underperformed the stock market (SPY) for so long, that is where I have focused our investments. Again, this monthly chart shows the HUI index could very easily beat the S&P 500 for years to come.

Uncategorized

Continued Adding To Miners

During the time between my last post and yesterday, I have continued buying back miner shares that I sold back in late January. The summer doldrums have kept a lid on things, and while the downtrend has has not broken, and my purchases appear to have been early, I am happy to say that they aren’t much below my entry prices, since it was the spike lower in that week of June 6th that I got started buying again. Now that summer is winding up, and the technicals have gotten back into sync suggesting a move higher is imminent, I have been busy again this week adding mining shares, enough so that the accounts I manage are back up to 84% invested, with only 16% cash left to deploy. I also initiated my first buys in the Uranium mining sector, with names like CCJ, NXE, DNN, UEC, UUUU, PALAF, URG, and DYL.AX, and will look to build up the positions.

With the new chairman’s first rate decision out of the way as of Wednesday, and after a strong up day for both precious metals and uranium miners yesterday (Thursday), I believe the stage is set for a decent rally or more, over the next 6-10 weeks into late September or early October. For now I only have my BUY cap on for the next few days, and will wait to see how strong the rally is, to decide if I will trim into this next intermediate move higher, and how much to sell if I do any selling. One thing to keep in mind is that technology stocks seem to be rolling over finally. That could eventually be a source of funds that flow into miners and metals and support them, but initially I would expect our holdings to get dragged lower as everything gets tossed out in the early stage of a bear market if there is panic. I don’t know if a raging bear is around the corner, but I know we are invested the best group to fight it, and eventually benefit from a capital rotation event.

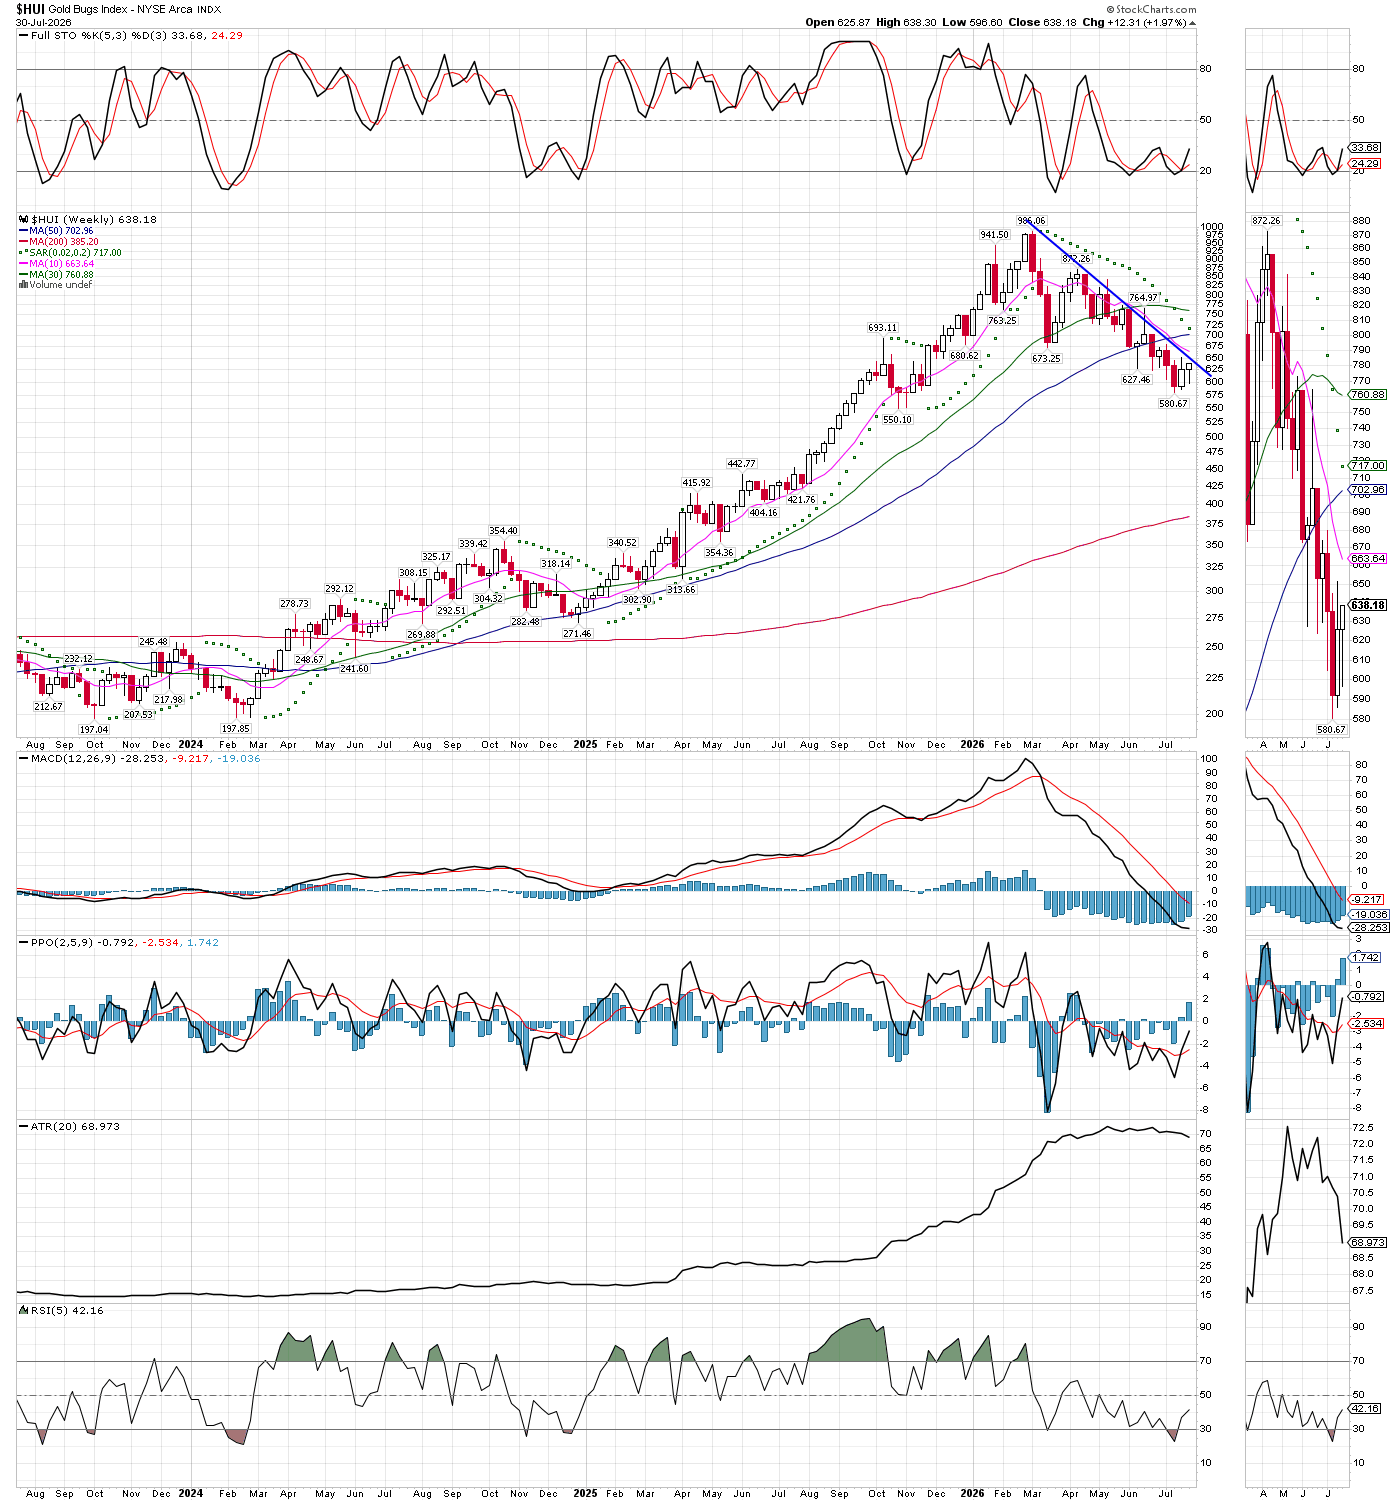
For now just a quick weekly chart of the $HUI index. Recall that I don’t treat trend lines as specific points that matter, so I draw them the way I can best see the bigger picture. Some insist on only touching the tip of each wick, others place their lies where they have the most contact points, even if each top goes over the trend line for a short while, but to me I just want to see the obvious trend direction and slope from across the room, and when that line is broken, to expect a move in the opposite direction. In my experience these lines get tested and “broken” all the time, only to come back and get into the trend again. Its the clear and obvious breaks that cause me to take note.

By my measure, HUI isn’t there just yet as I type, but a strong close to this week, or upside next week, will be a sign this pullback is over for now. The move lower has extended long enough considering the seasonal tendencies, and the many very oversold technicals such as stochastics and MACD, sentiment too is in the dumps. The window won’t be open for long, but seems to me this is a good time to increase exposure.

Uncategorized

Breakdown! Time To Start Buying Miners and Metals Again

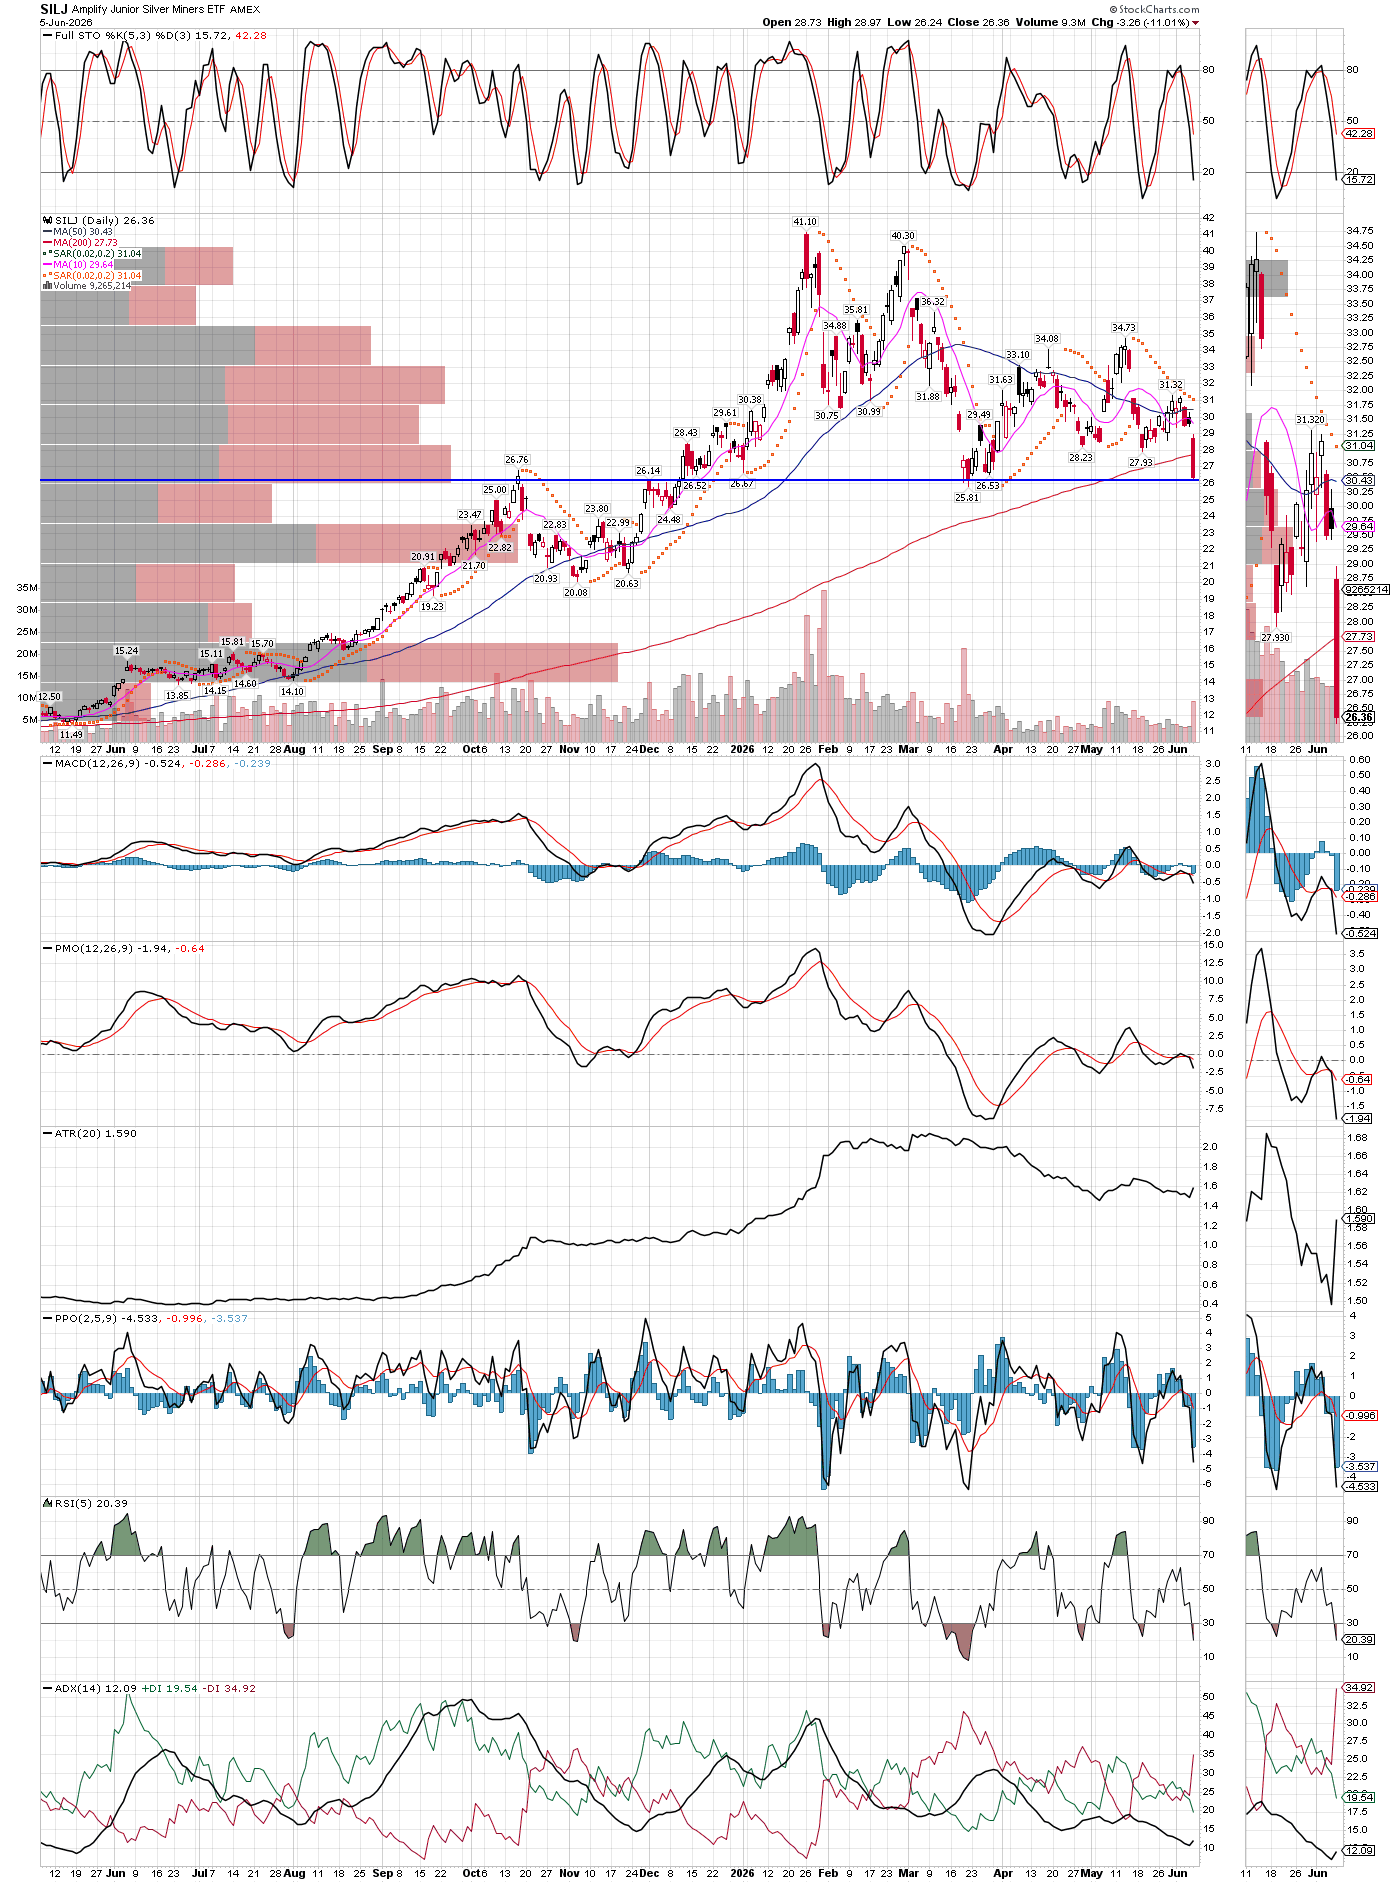
I started buying miners again today. I might be early, since everything was crashing today, but the areas I have been focusing on came into important support zones after a substantial 4-5 month correction in the roaring bull market. Seasonally, we could still have a few more weeks of weakness in the miners, but today it became time to start buying again. I added almost across the board to my mid-cap producers and a few juniors, as well as the SILJ and SLVR etfs.

I will let the charts do the talking. Remember that lines, whether a moving average, trend line, or support/resistance, are only areas to consider. A true break does not happen in the instant something crosses the line, it can only be known some time after if the break was true or not. The point is that far more often than not, resistance and support hold up, rather than continuing into a new trading zone. Let’s take a look at the SILJ daily chart first.

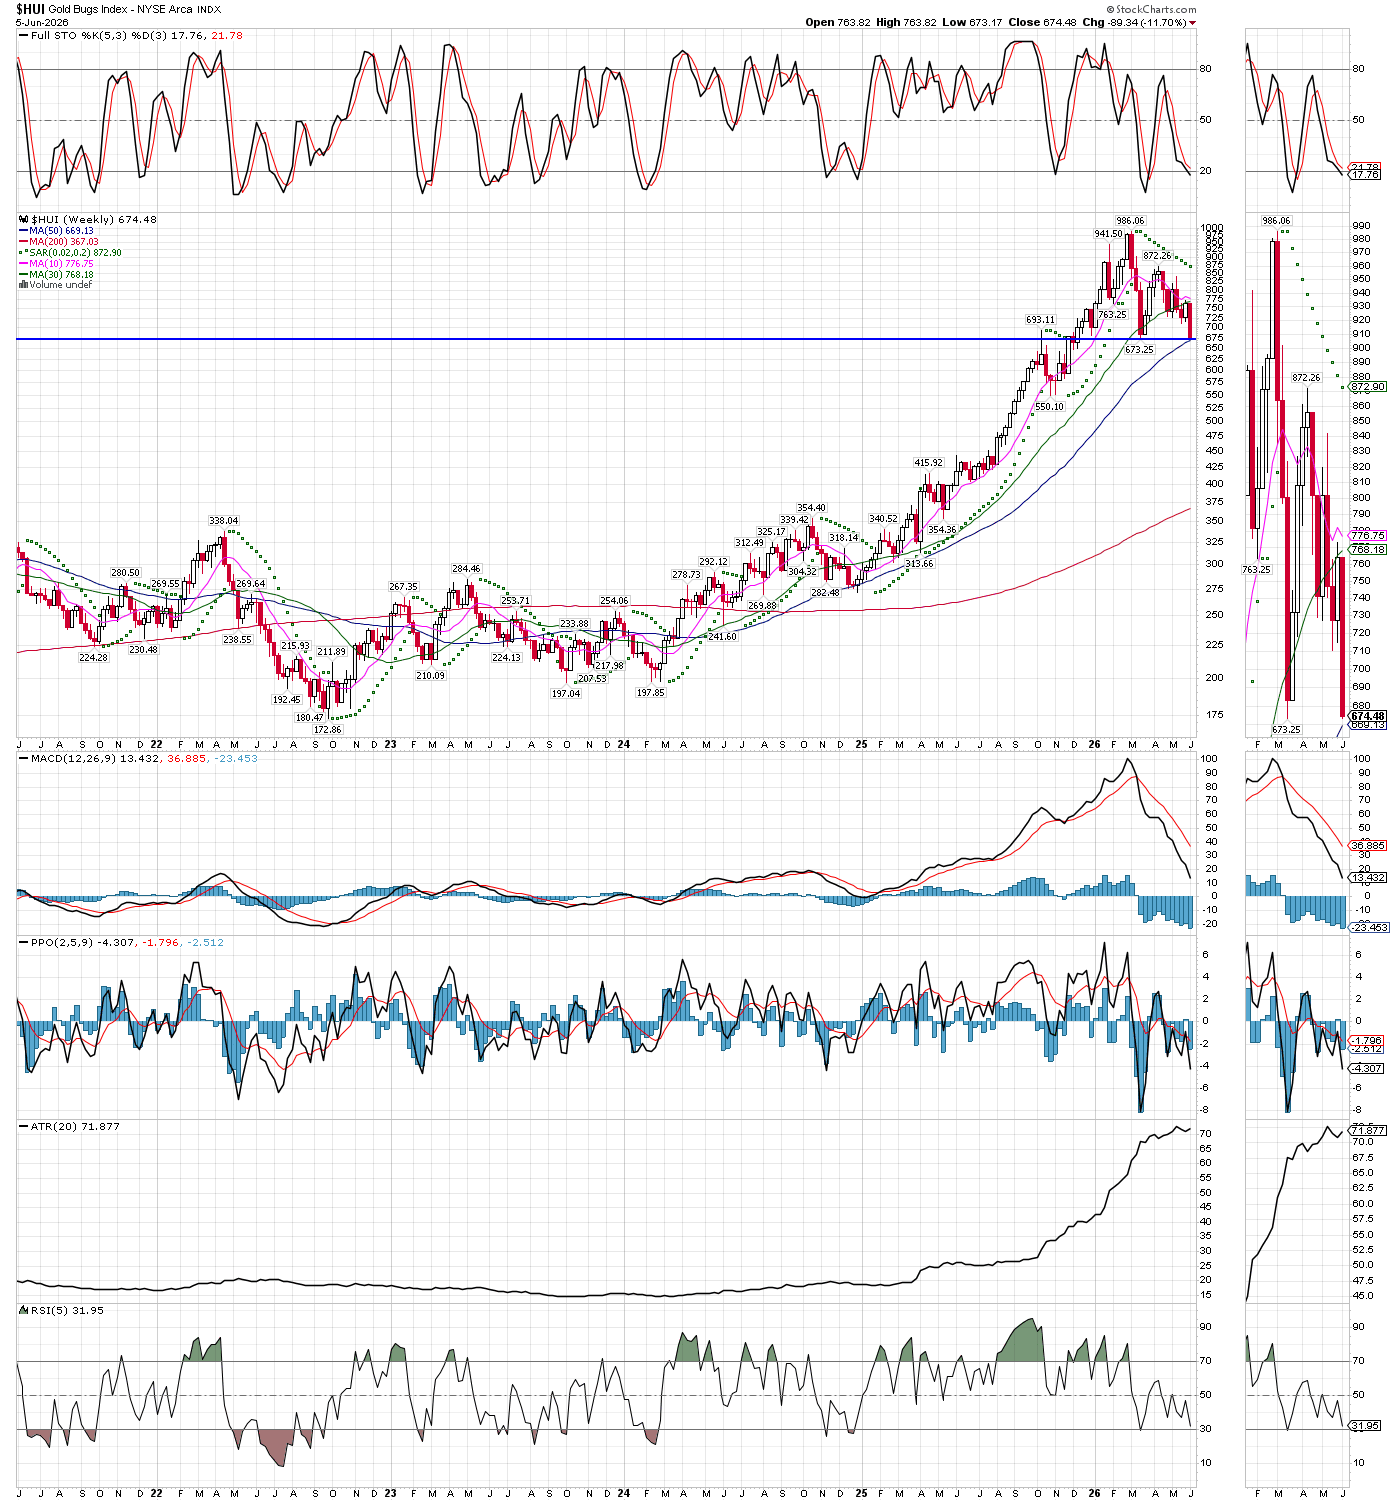
Now we step back and take a peek at the weekly $HUI chart of the gold miners.

Pretty clear to see this is the time to take positions, and add to our winners. Whether today was THE bottom or not remains to be seen, as we have some conflicting signals, which means we should be prepared with nerves for further downside in case it occurs. However, one can never be 100% sure, we can only play the probabilities. I am comfortable starting to buy in size here, after selling roughly 60% a day or two before the highs in late January. I expect we will have to wait awhile for momentum to return to the upside, and I even hope for lower prices to keep buying, but I was busy today acquiring my favorite positions to hold for the remainder of the bull market.

Uncategorized

Bigger Picture

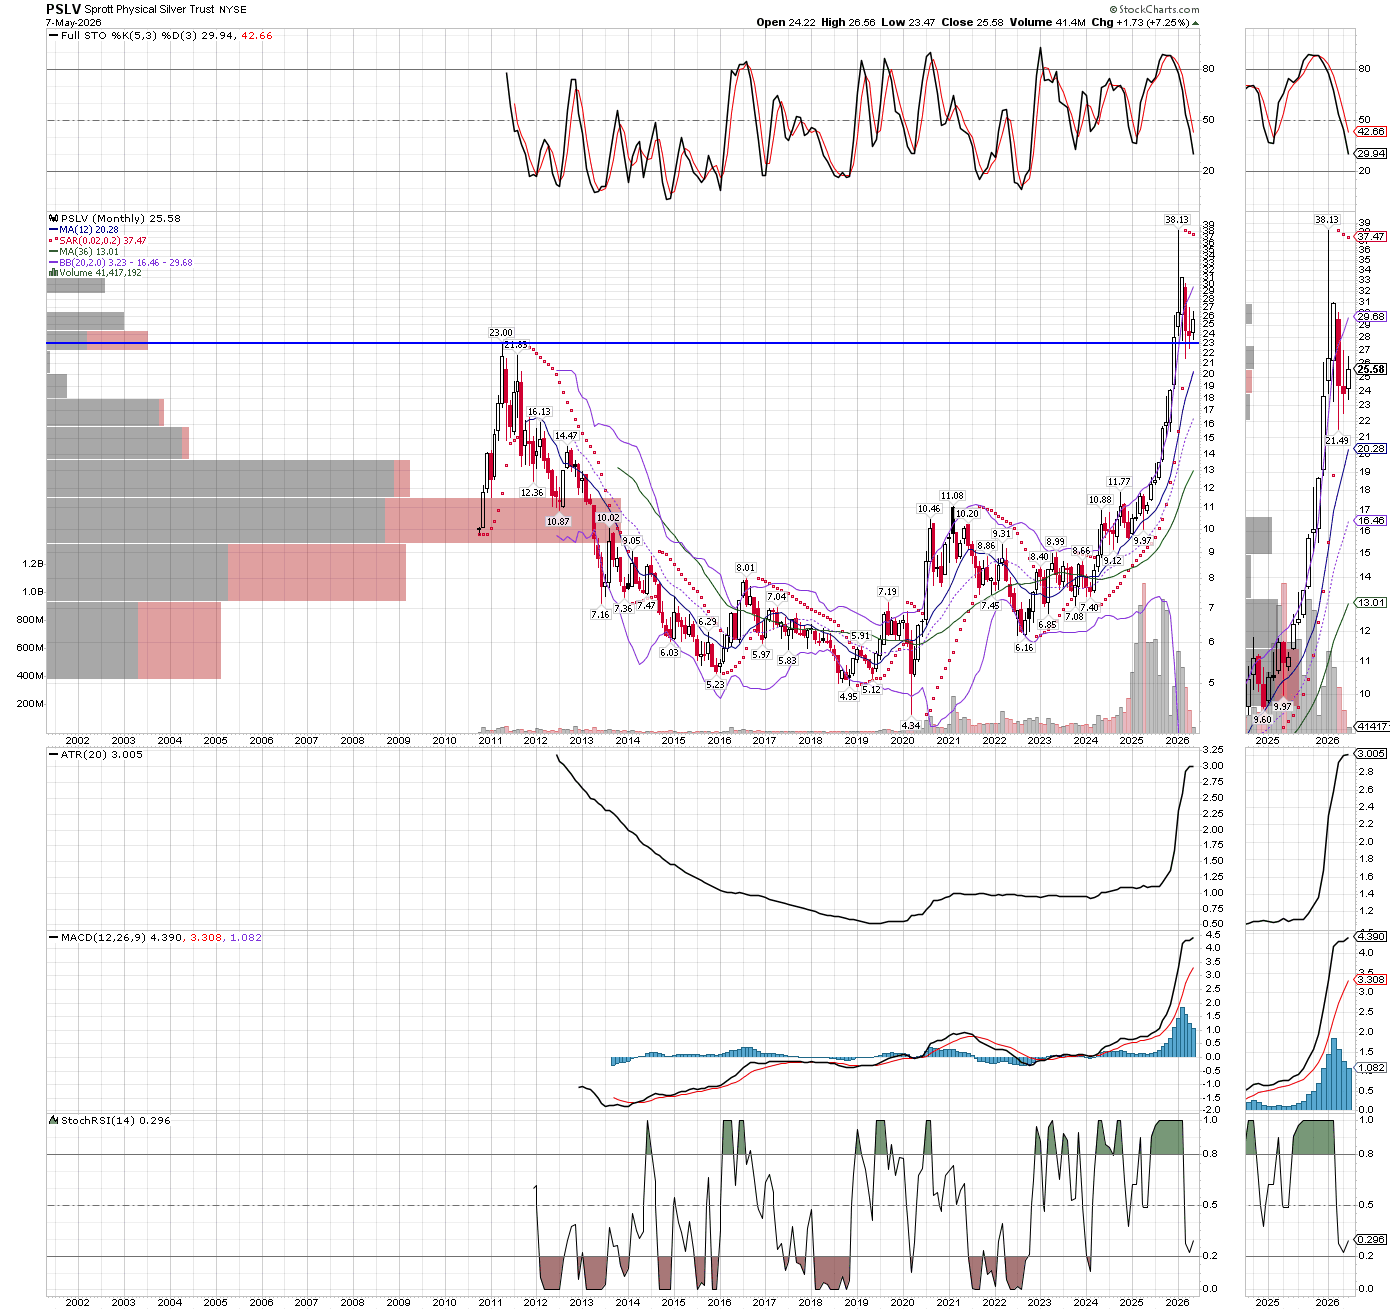
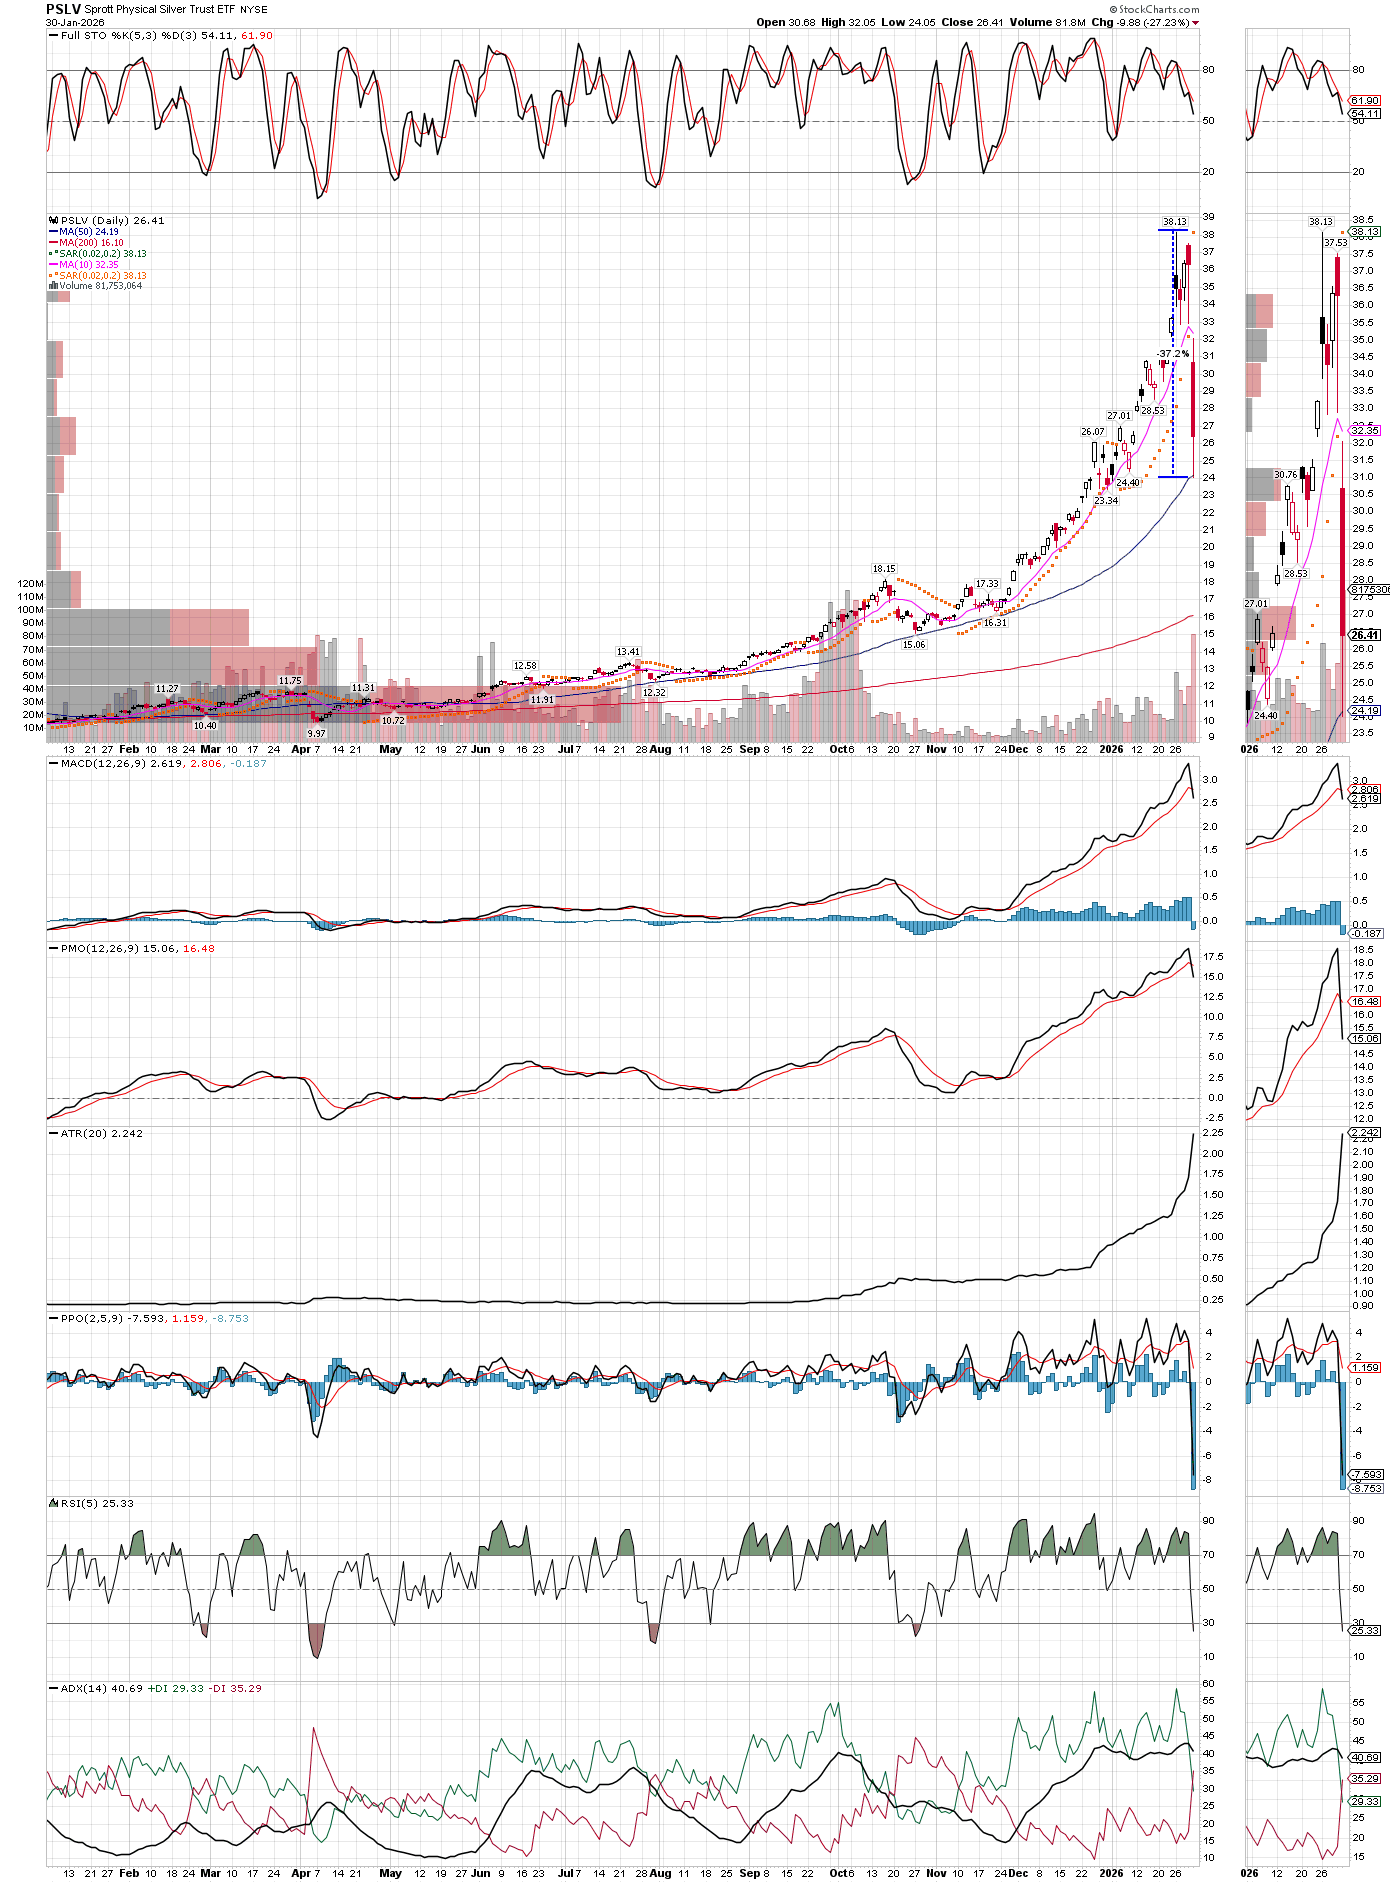
After violent moves like we have seen in the last year for Silver, it helps to step back and look at the longer-term charts. This gives us clarity by helping understand when a bull has more upside, or its time to look elsewhere for opportunities, even short the very things we rode higher! The PSLV etf chart below should make it clear, not only was the breakout significant, but also notice how well its price stays elevated in the face of downtrending stochastics. The relative strength is screaming that there is much more upside.

What we don’t know is when exactly it will begin to move higher with force again. However, if one has proper position sizes in relation to their risk tolerance, we don’t need to know when exactly, just knowing it will go much higher and soon enough, such as the stochastics reach oversold in next month or two, is enough to give us strong hands. As Rick Rule says, a good investment is when you can ask WHEN might it occur, rather than IF it will occur? On that note, he has been a buyer of silver miners recently, a few months into this big pullback, and so have we.

Uncategorized

Getting Ready To Buy Back What We Sold

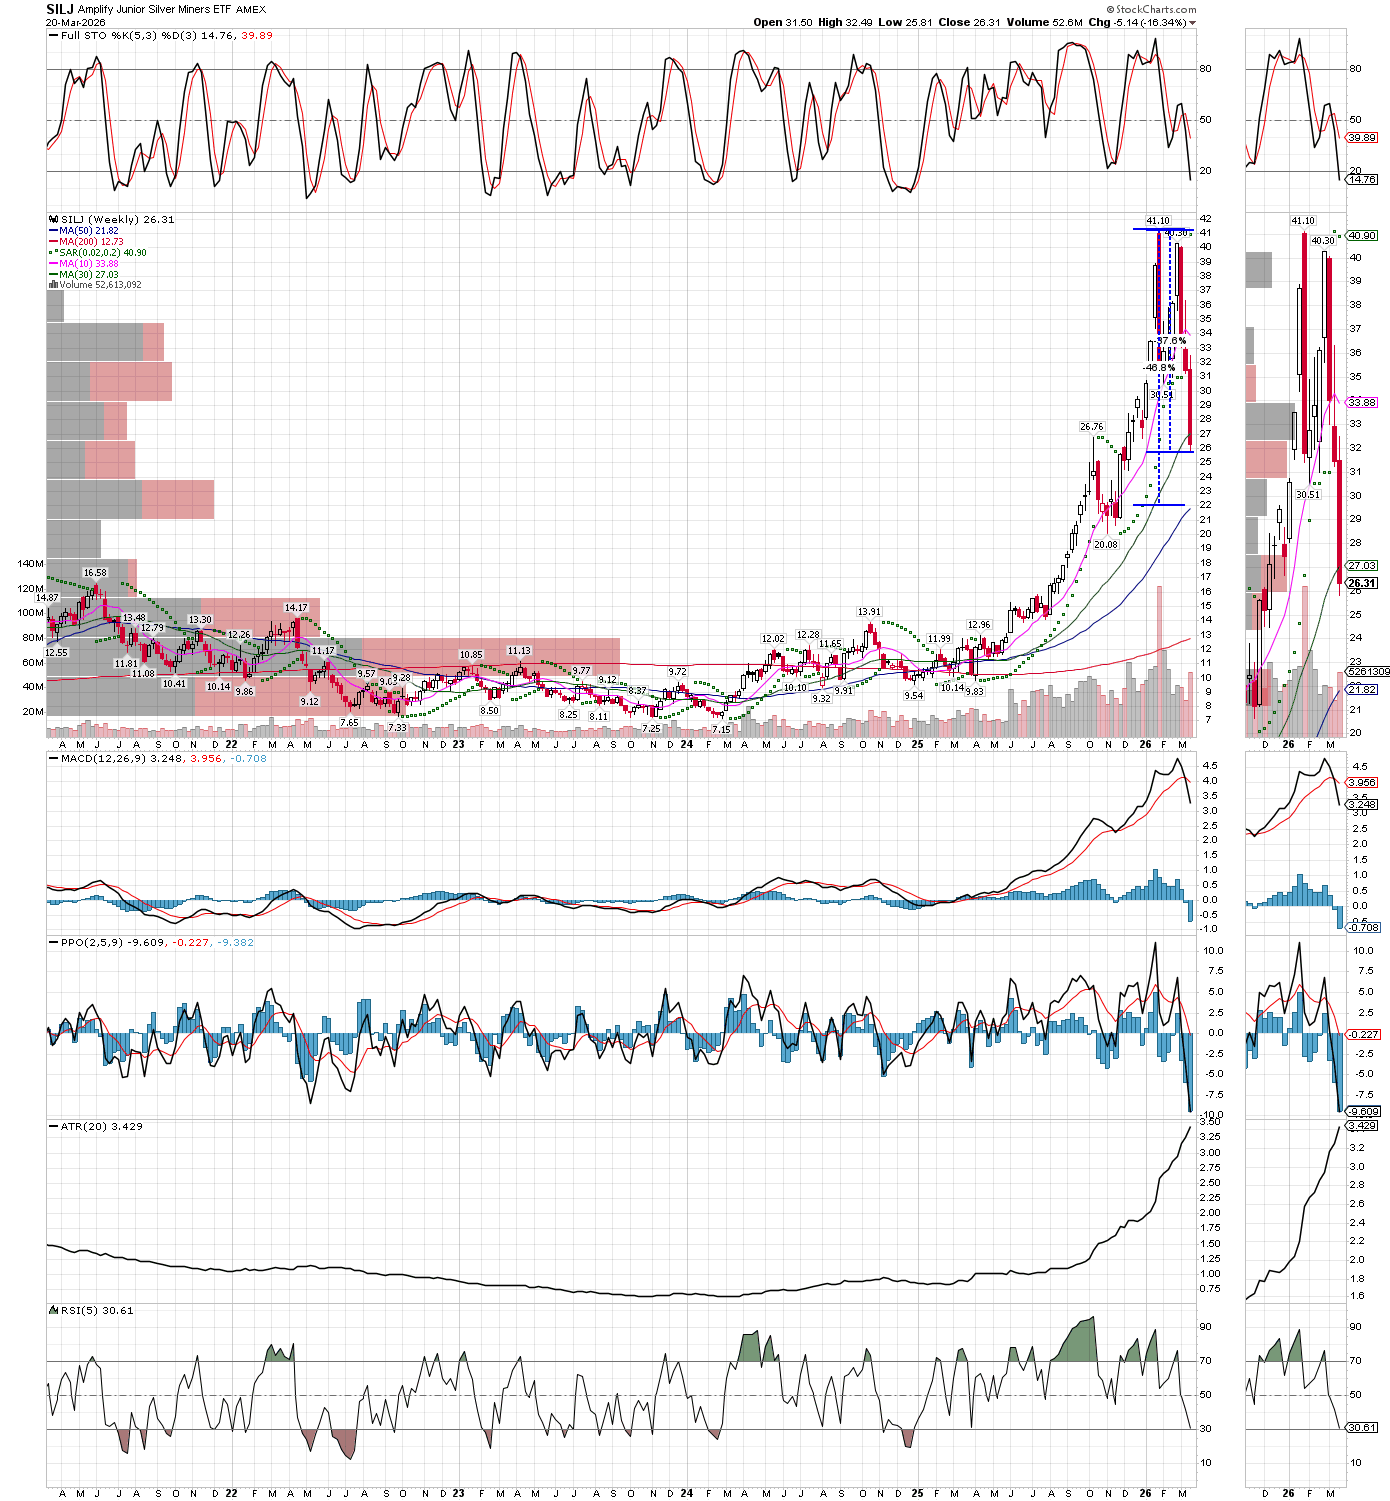
Now that Silver and the miners have pulled back sharply, I am looking to invest in the miners again over the near term. I actually bought back some SILJ, SLVR, ASM, SBSW, AAGFF, and few others on Friday, but so far these are smaller purchases. If they continue the downward momentum early next week, I will double what I have just re-invested, as Silver was down almost $13 last week, and is far closer to support areas I like that it’s high at $120. I will also buy the recognizable names like CDE, HL, PAAS, and WPM along with some juniors that have been decimated in the pullback, some dropped more than 50%!

I will buy a lot more if SILJ can drop to its 12 month MA, only a few dollars away now, as the MA should be up near $24 by April 1, the new monthly print. See below the weekly stochastics are nearing oversold, lets wee how they look when next weeks starts, but the MACD weekly might still need some time to repair. I hope to be more fully invested before next Q1 earnings reports start being reported for miners in mid-May, as these will be their best reports in history. So, I am patiently waiting to get “heavy” again, and realize, even hope that my buys on Friday were early, and their prices drop a little further and run some more time down on the clock. In any case, another great buying opportunity lies in here somewhere, but as always, the most important part of any bet is the position sizes one take. I will stick to 3% total portfolio risk on these entries, and might even look to take some profits one the earnings news when they come out. In other words, this trade is likely not the long term buy and hold I advocated early in the bull, rather a trade around the intermediate cycles that last just a few months. I still think the general stock market is going to have a much deeper pullback (maybe after a short rally first because already oversold), and this could drag down the metals and miners for a better long-term entry again, maybe late in the year, like October or November. Then will look to buy and hold again for the remainder of the bull, which should still have a few years in it, and big percentage gains. It might take a little while, but I fully expect the metals and miners to make new all-time highs before the bull is finished.

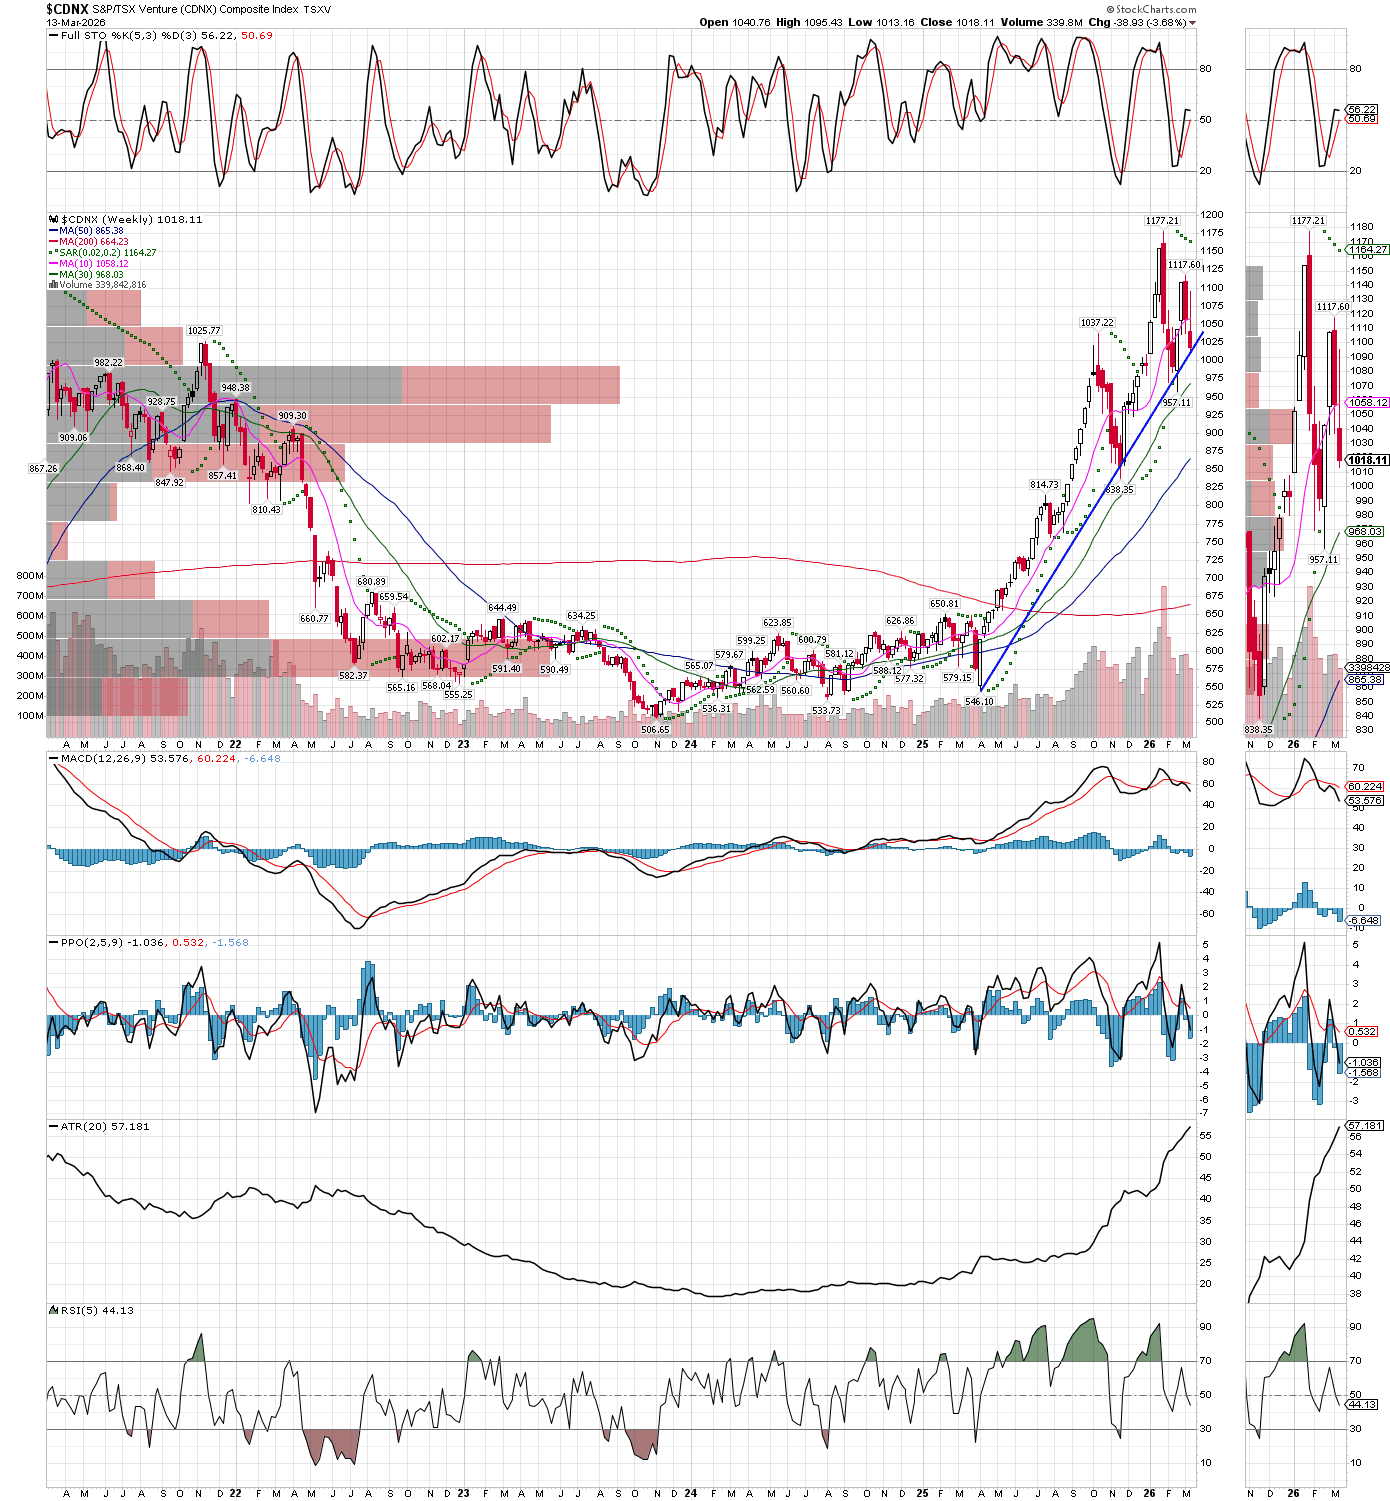
And note this next chart is already over one week old, as the $CDNX closed Friday down at 911

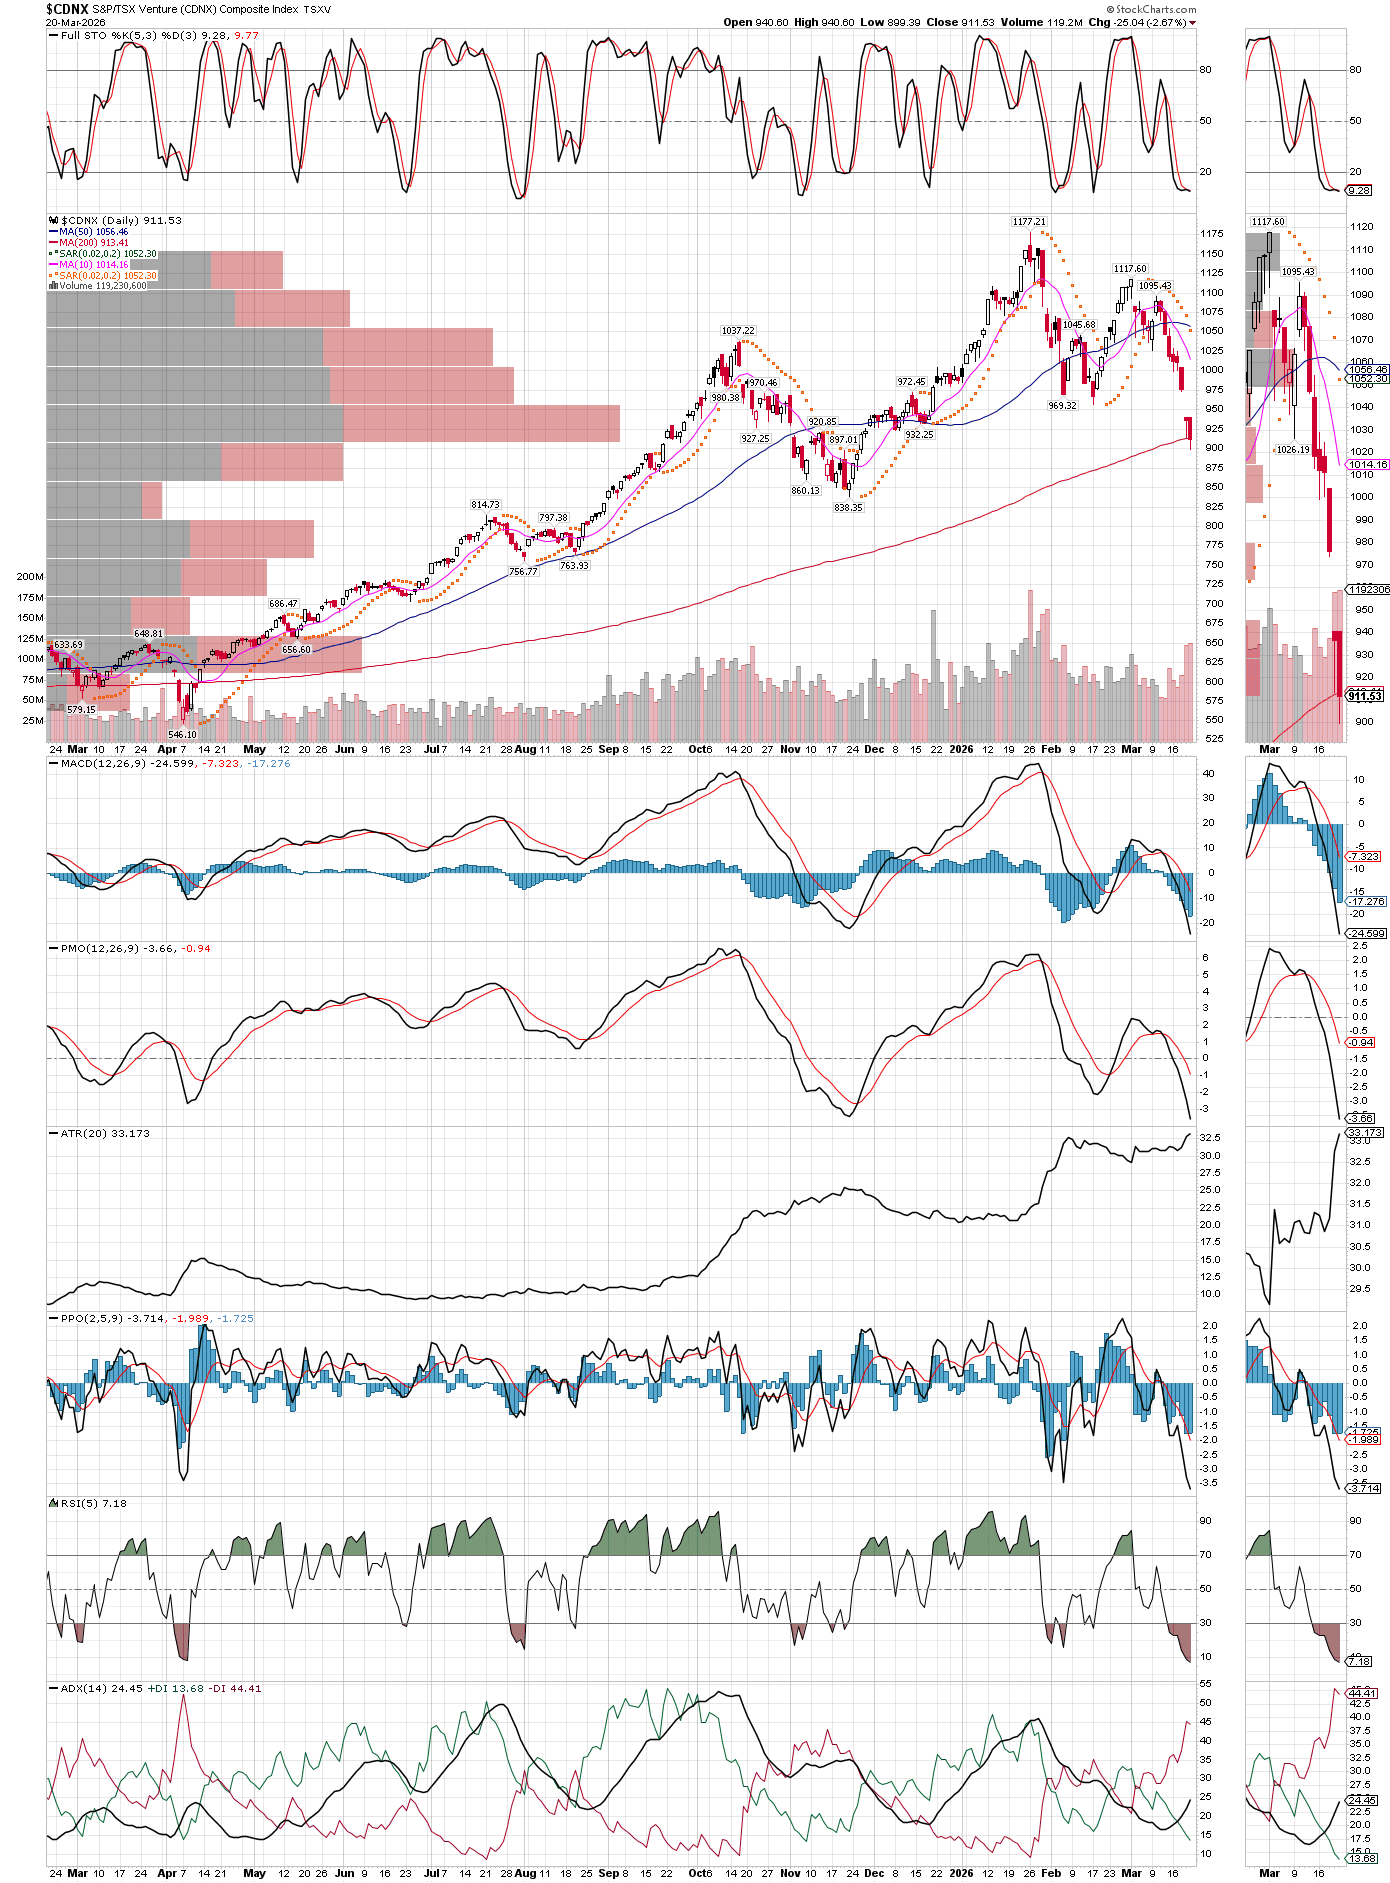
So the juniors already broke that trendline, not good, but now lets look at the daily, where we see the $CDNX already at its 200 day MA, as good a time to try buys as any.

Uncategorized

Gold Futures Have Already Corrected 21.5%

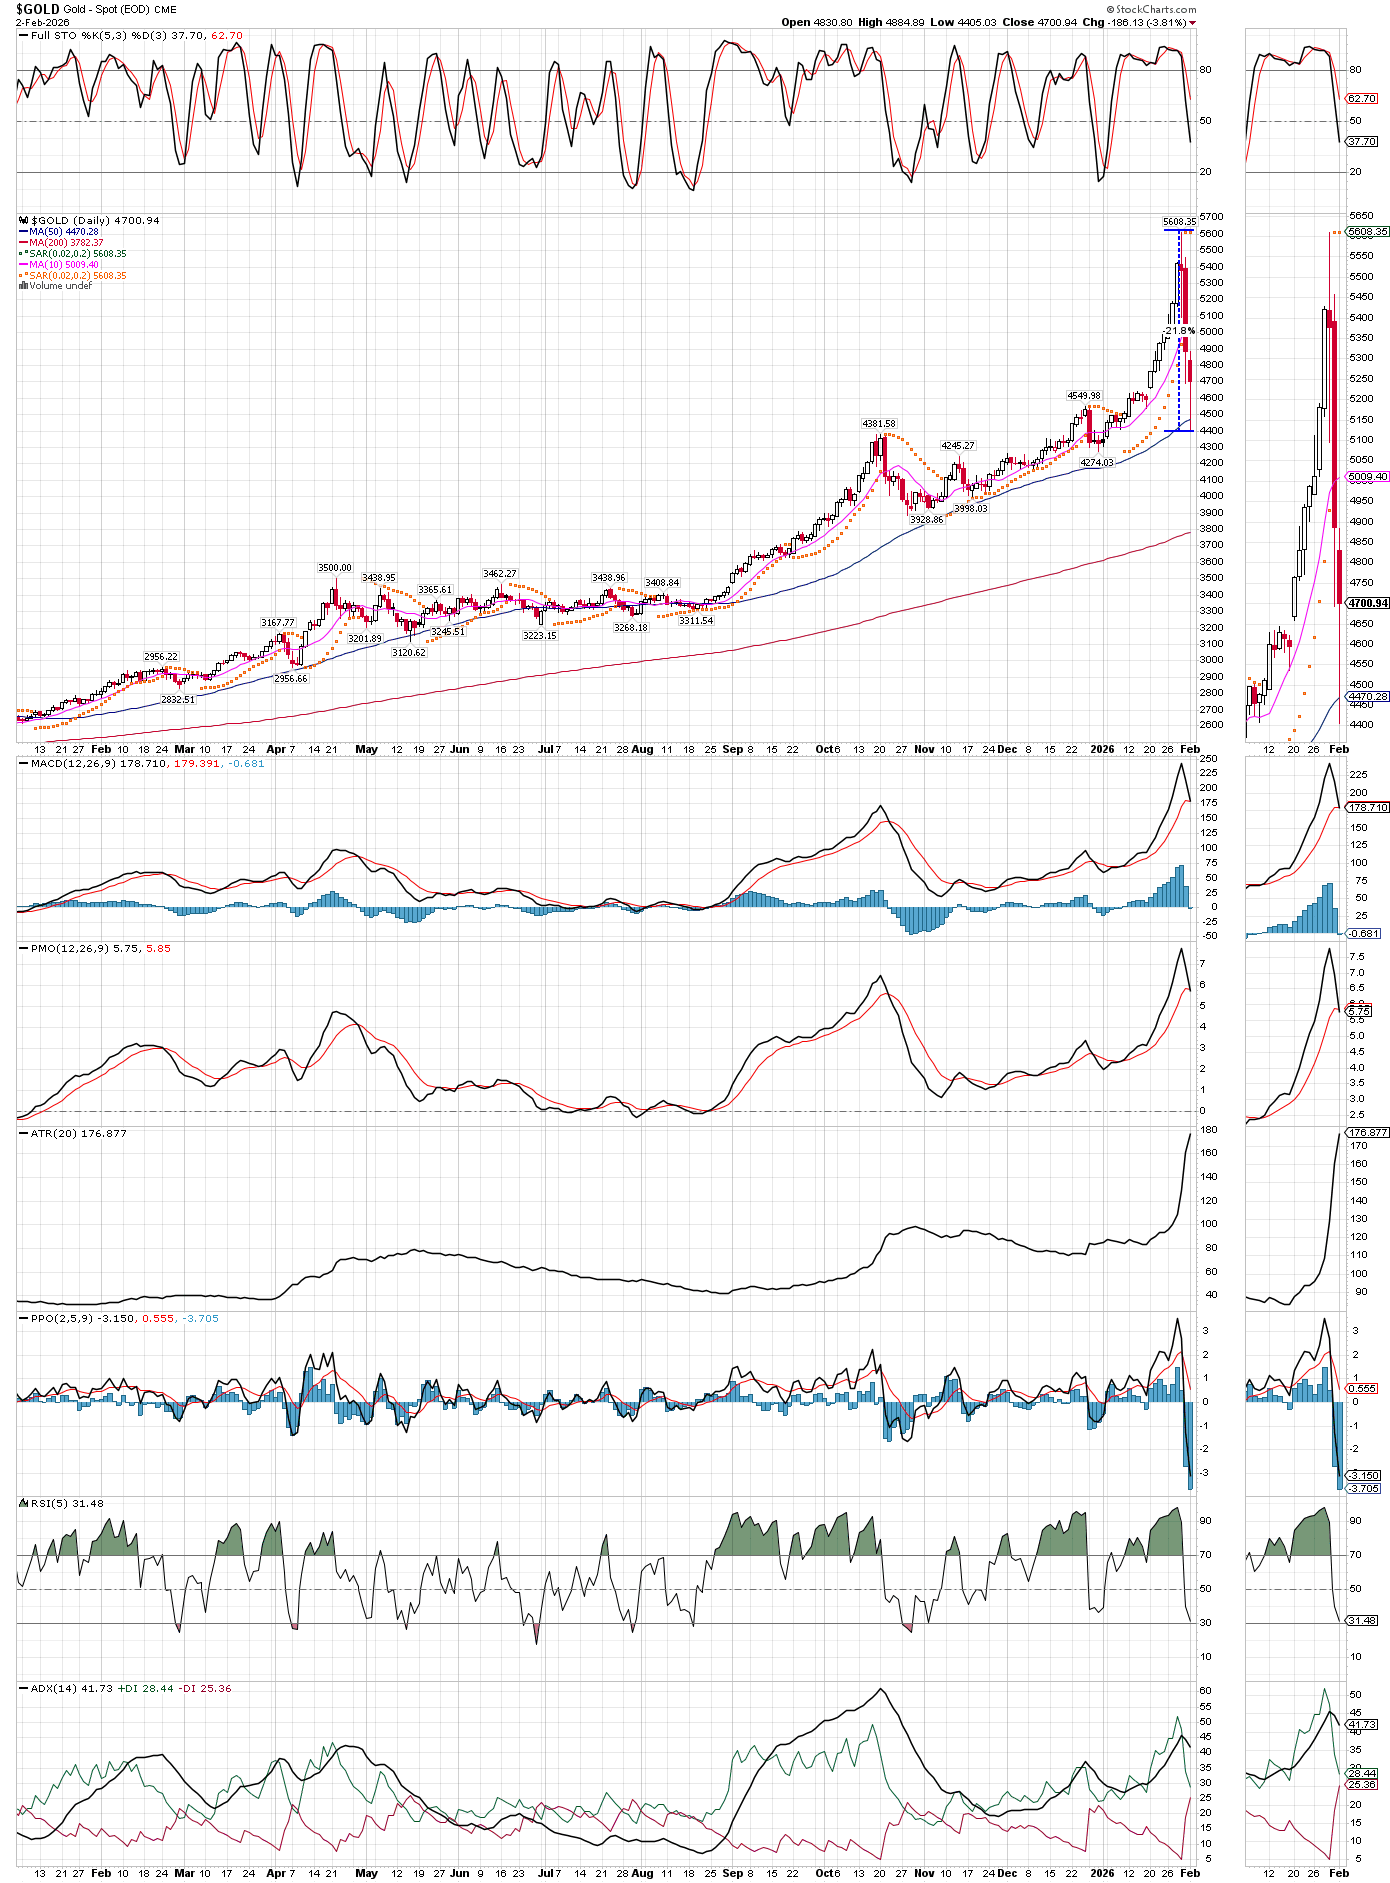
Readers know I am looking to re-deploy funds and profits taken last week. While the metals and miners have already pulled back in price to levels I consider attractive, I am waiting for more time to pass, as corrections are usually functions of both price and time. With price objectives met, I will wait for some time to pass, with the plan that if prices come back down to this area after 6-10 weeks (assuming they bounce soon, then drop again), or if prices just go sideways overall for a few weeks while technicals reset, then I will be ready to buy heavily again.

Also, the extreme volatility must be respected and accounted for, with smaller position sizes in order to contain risk. This forces smaller position sizes, so that when things calm down, one is not invested heavily enough for the next move higher. Much better to wait for some calm, let prices find an area where there are similar numbers of buyers and sellers, so that emotions calm down and. make it conducive to larger bet sizes. After all, position sizing is everything, and there is no need to step in front of a moving train. If I have to pay slightly higher prices but also have some time that has passed and reset the technicals, so be it, then I can place larger bets for a potentially more extended move higher again.

Gold has already dropped 21.5% from the high last week to the low yesterday, that should be enough to shake out many bulls, but things are volatile right now and a big move up or down from here would not shock me. So, its time to sit and keep our powder dry for the next setup. It could even come in energy, like coal and oil stocks, but my hunch is it will still be in the precious metals, there is very little chance that the bull is over in precious metals and miners.

Uncategorized

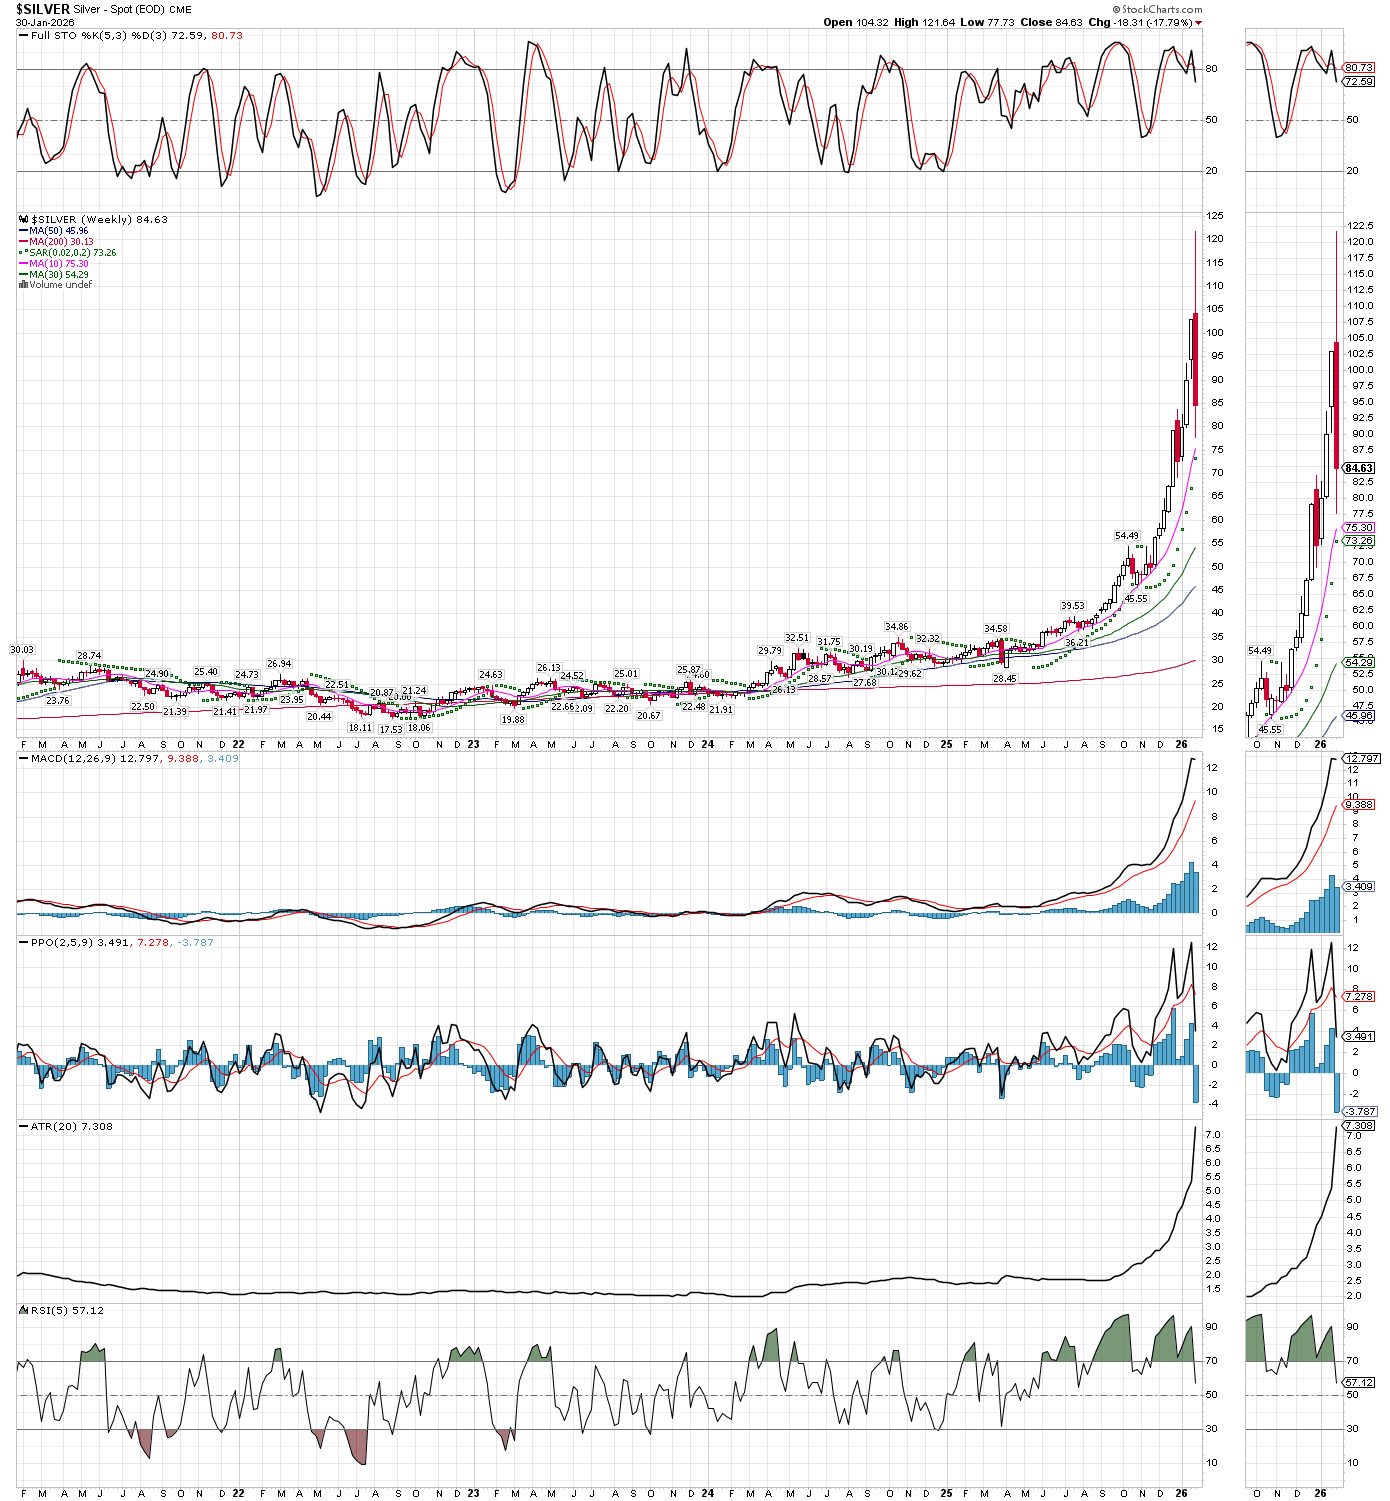
WOW! Silver From $50 To $120, then back to $80!

What a ride its been! I have been busy lately, selling over 60% of our holdings, into the biggest spike in silver in history. We were fortunate to be selling all last week, just in front of the worst clobbering in silver’s history. Absolutely insane action, so I don’t have much time to write here today, just a quick update, and the charts to show the action. There is too much to talk about, like PSLV’s near-record discount to NAV, suggesting this bull market is far from over, as well as how I think this correction might play out, though its already pulled back enough in price that I am interested, but not enough time has passed. We need time for technicals to reset, for the biggest potential gains to resume, but with such a drastic pullback, it also would not surprise me to see silver trade back up to the highs soon, either. In any case, I do plan to add back shares in miners and PSLV, along with the SLVR and maybe SILJ etf, and will be happy to post here when I do. Its been a spectacular run and we have made a fortune, some of our LEAPS are up over 20x, most are up over 10x, as well as many miners’ shares up 7x-10x, truly remarkable gains in less than a year!

Historical moves are being made almost daily now. We still have just under 40% of our precious metals and miners holdings, heavily skewed to the miners now, since there are catalysts to help miners outperform over the next several months, such as blowout earnings reports starting next week, and even bigger upside surprises expected for next quarter’s results (Q1). The bull isn’t over, and sharp, scary corrections are a tell-tale sign that there is more upside to come. Media is now full of people forecasting silver at $200-$500 before the bull is over, a sign of short-term froth in the market, though they will likely be proven correct as this silver bull has already broke several records when compared to all past bull markets in the metal. Even gold, which has dropped 16% from its high already, in just a few days, still had its best monthly gain in the last 100 years, including the beating it took on the last day of January to close the month. The daily chart looks ugly, while stepping back to the weekly or monthly, one can barely see the weakness.

Uncategorized

Just Like That, Silver Is Over $50 Again

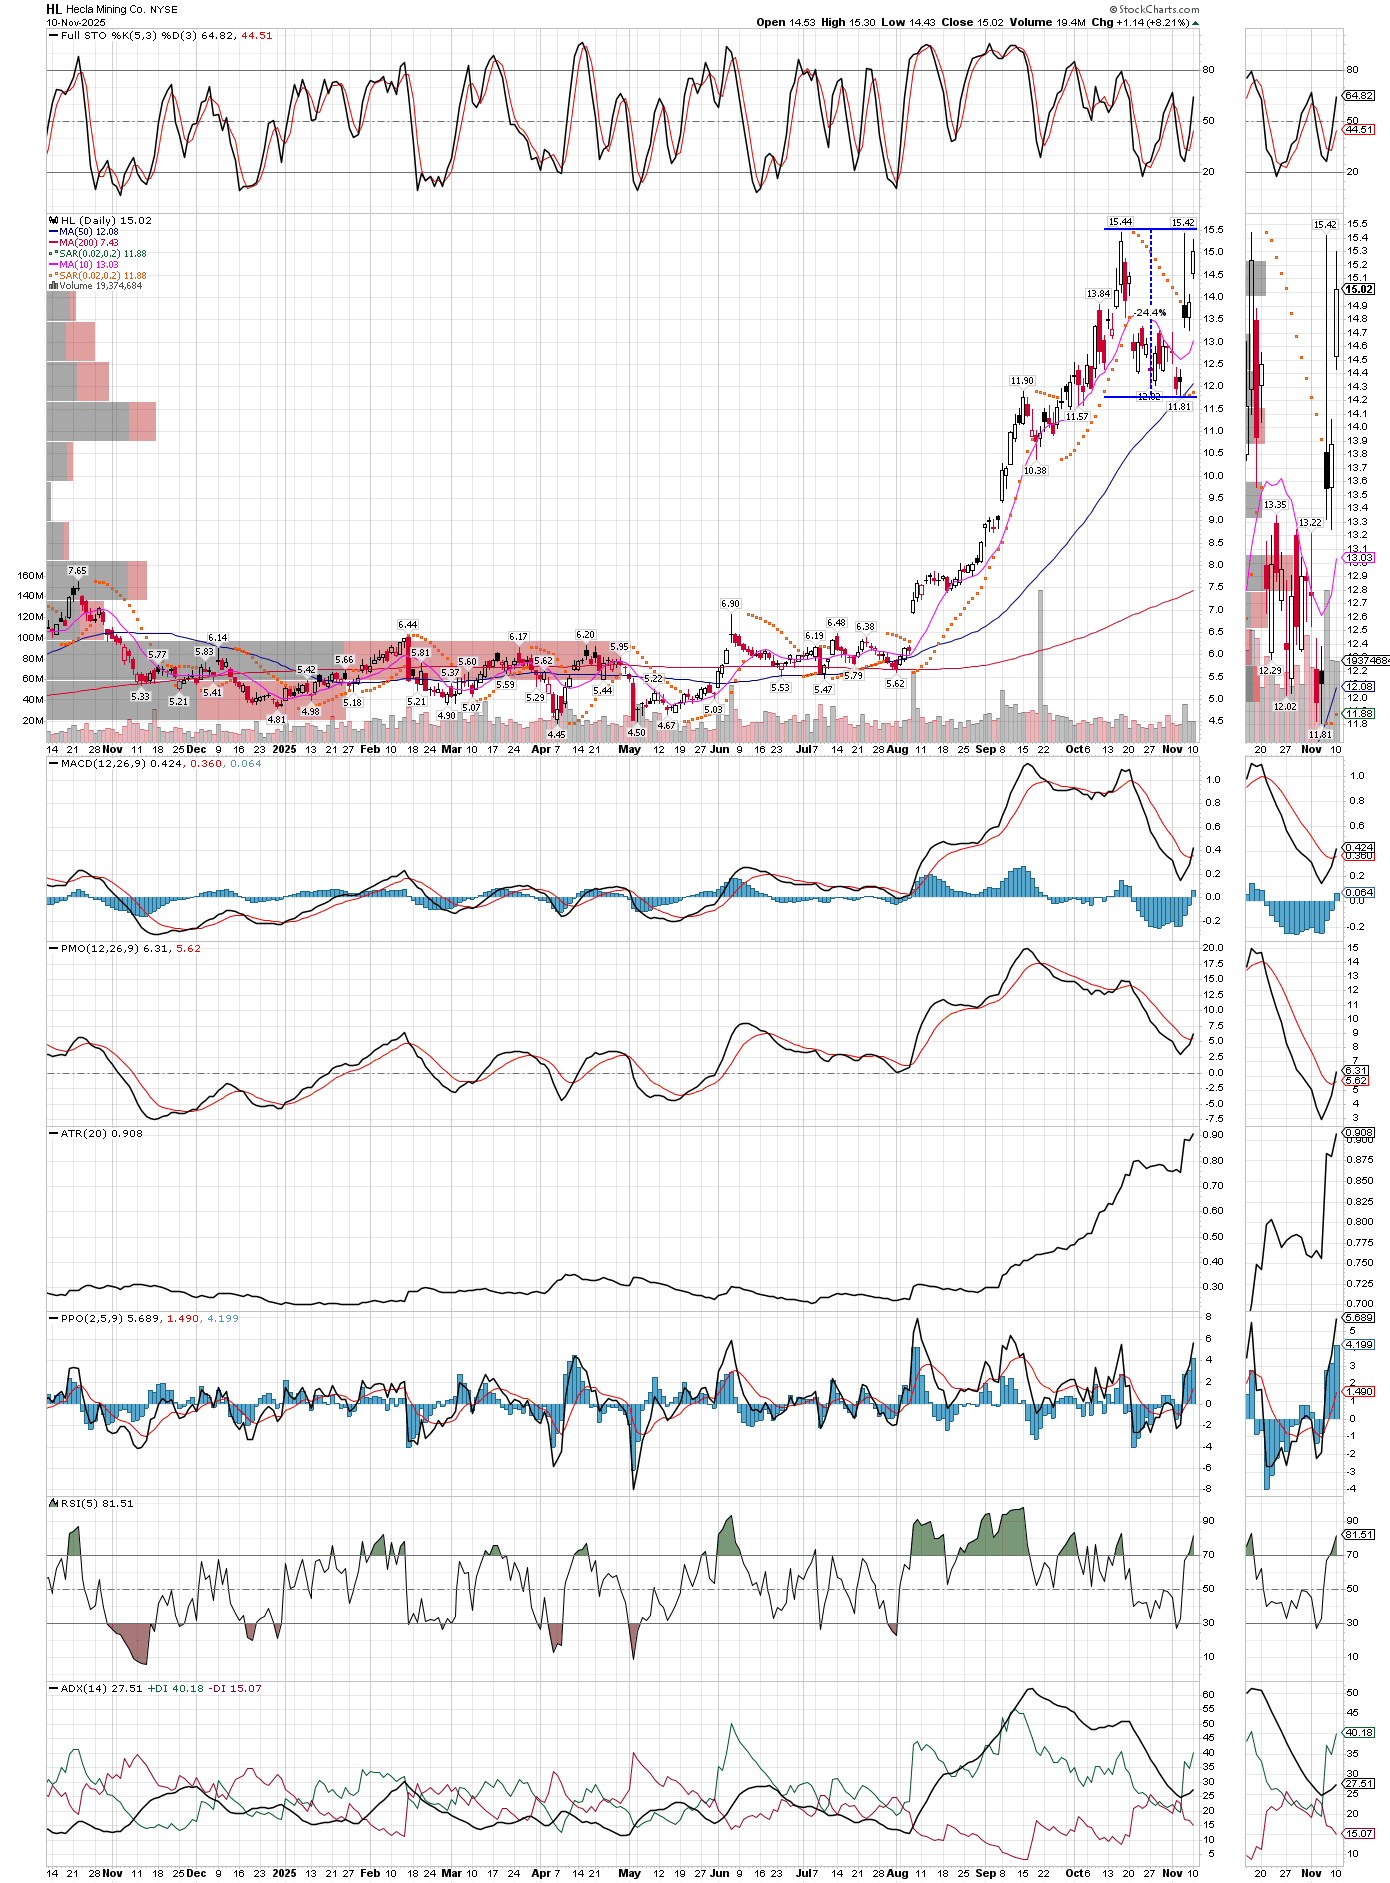
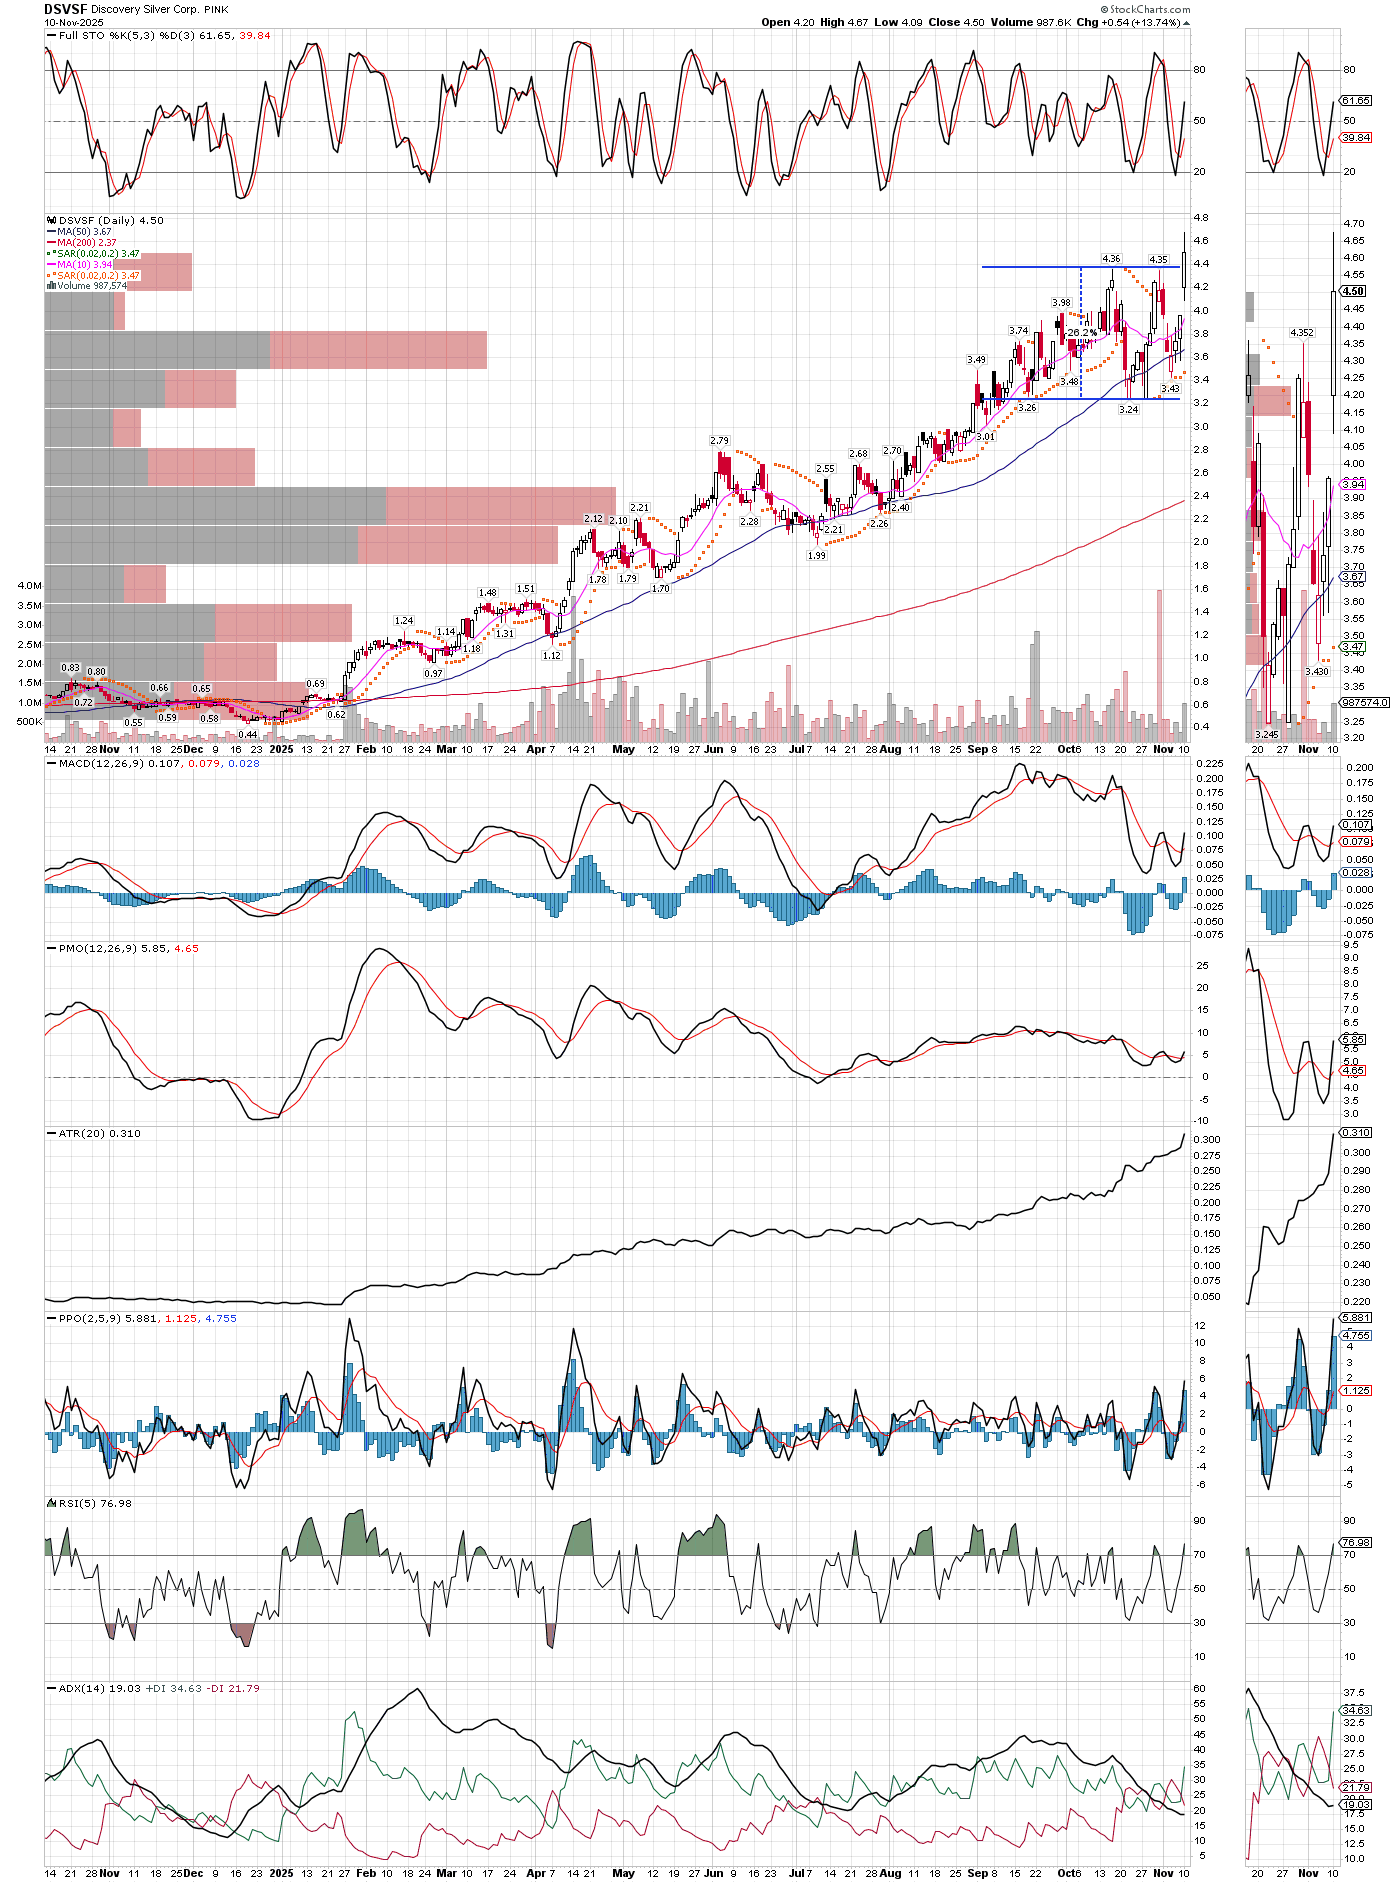
A sharp two-day bounce has silver well over $50 again, and while I cannot pretend to know if the correction is over, at least it is providing some breathing room. On top fo that, several miners are already right back up to their bull market highs, such as HL, and others like DSVSF already made new highs! Its a strong bull, after all, so those patting themselves on tha back for selling everything, now might seem to smart, as they have to decide when to get back in. I was a seller of 1/3 of our positions, but once the corrections reached 25% or more, started buying back into mining shares. No doubt its possible they drop again to test the lows or make new marginal lows, but that is the worst case scenario at this point, in my opinion, and should be followed by new bull market highs soon after. The longer silver stays over $50, the better the odds that the correction is over, and a close this week above $50.10 would be the highest weekly close of this bull market. As I type, silver futures are already at $50.85, though there is still time this week to close the gains. Let’s see what happens Friday at the close, for now here are the charts of the two stocks mentioned above, with their pullback percentages. If I am not mistaken, the SILJ etf also corrected a little over 25% before the big bounce in the last two days, so it is quite possible the worst of the decline is already behind us.

and DSVSF….

SIGN UP FOR UPDATES!

NO SPAM, EVER!