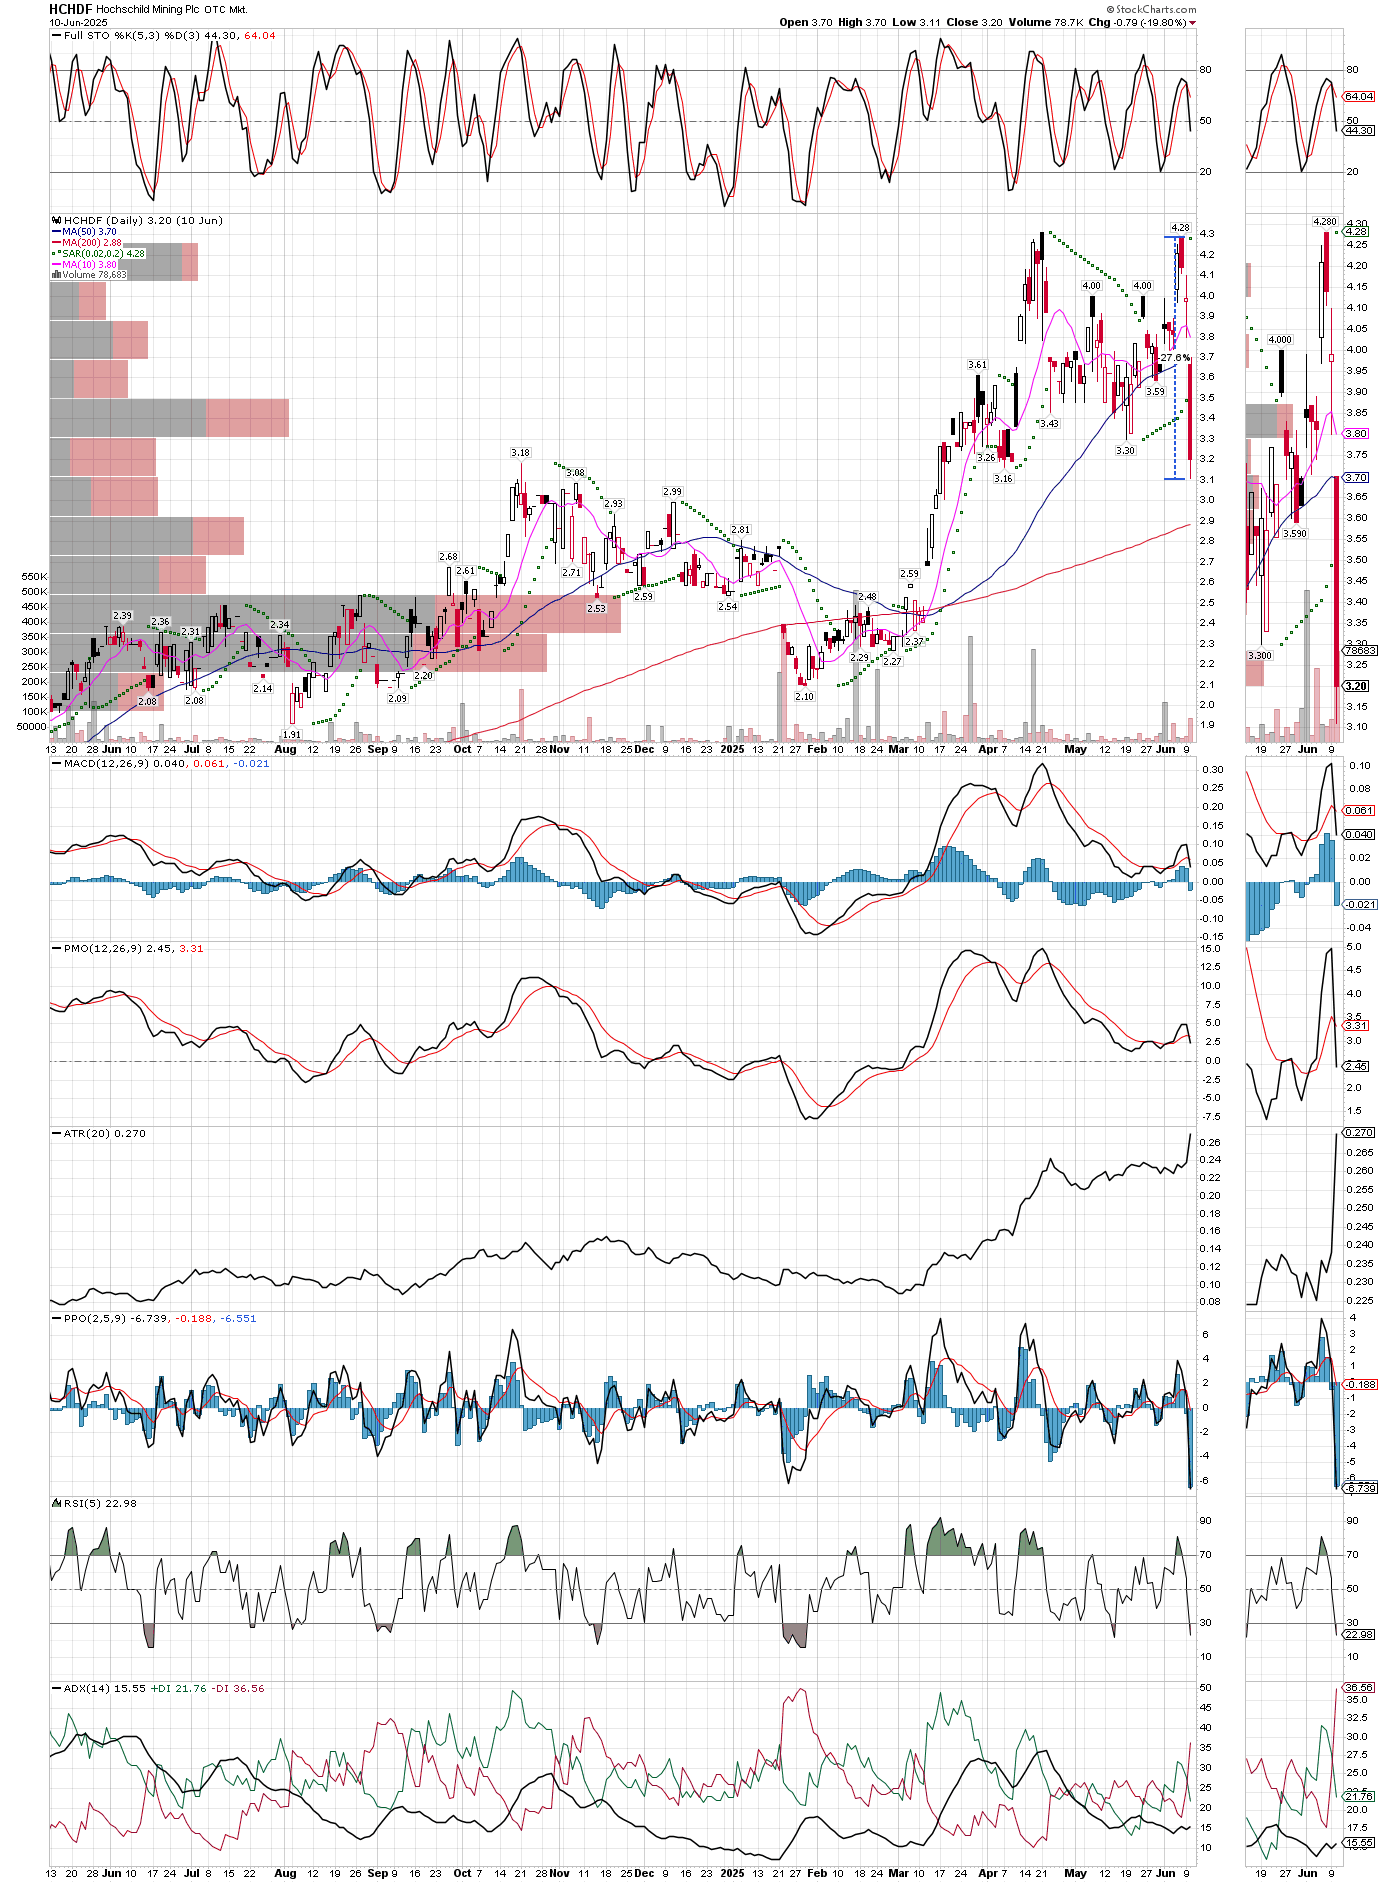
On the news that HCHDF (or, HOC.L in London) suspended one of their mine operations for six weeks to improve the output, Hochschild Mining dropped 20% yesterday, and is already down over 27% from the recent highs. We bought a full position at much lower prices, and yesterday we added to the position since I think the downside was overdone. Since we only added 20% more shares, our average total cost per share now is still only $2.38/share. We are not adding to many positions at this point, only in special situations like this one, and we might also add to AYASF (AYA Gold and Silver) if the can knock it down low enough on the news they are selling some stock to focus on expanding their Bourmaline project. Essentially, there has to be some news that is dropping a miner more than I think it should, considering the news. Other than that we continue to stay loaded up in miners as both silver and not platinum have been shaping up nicely, each making new mulit-years highs recently.
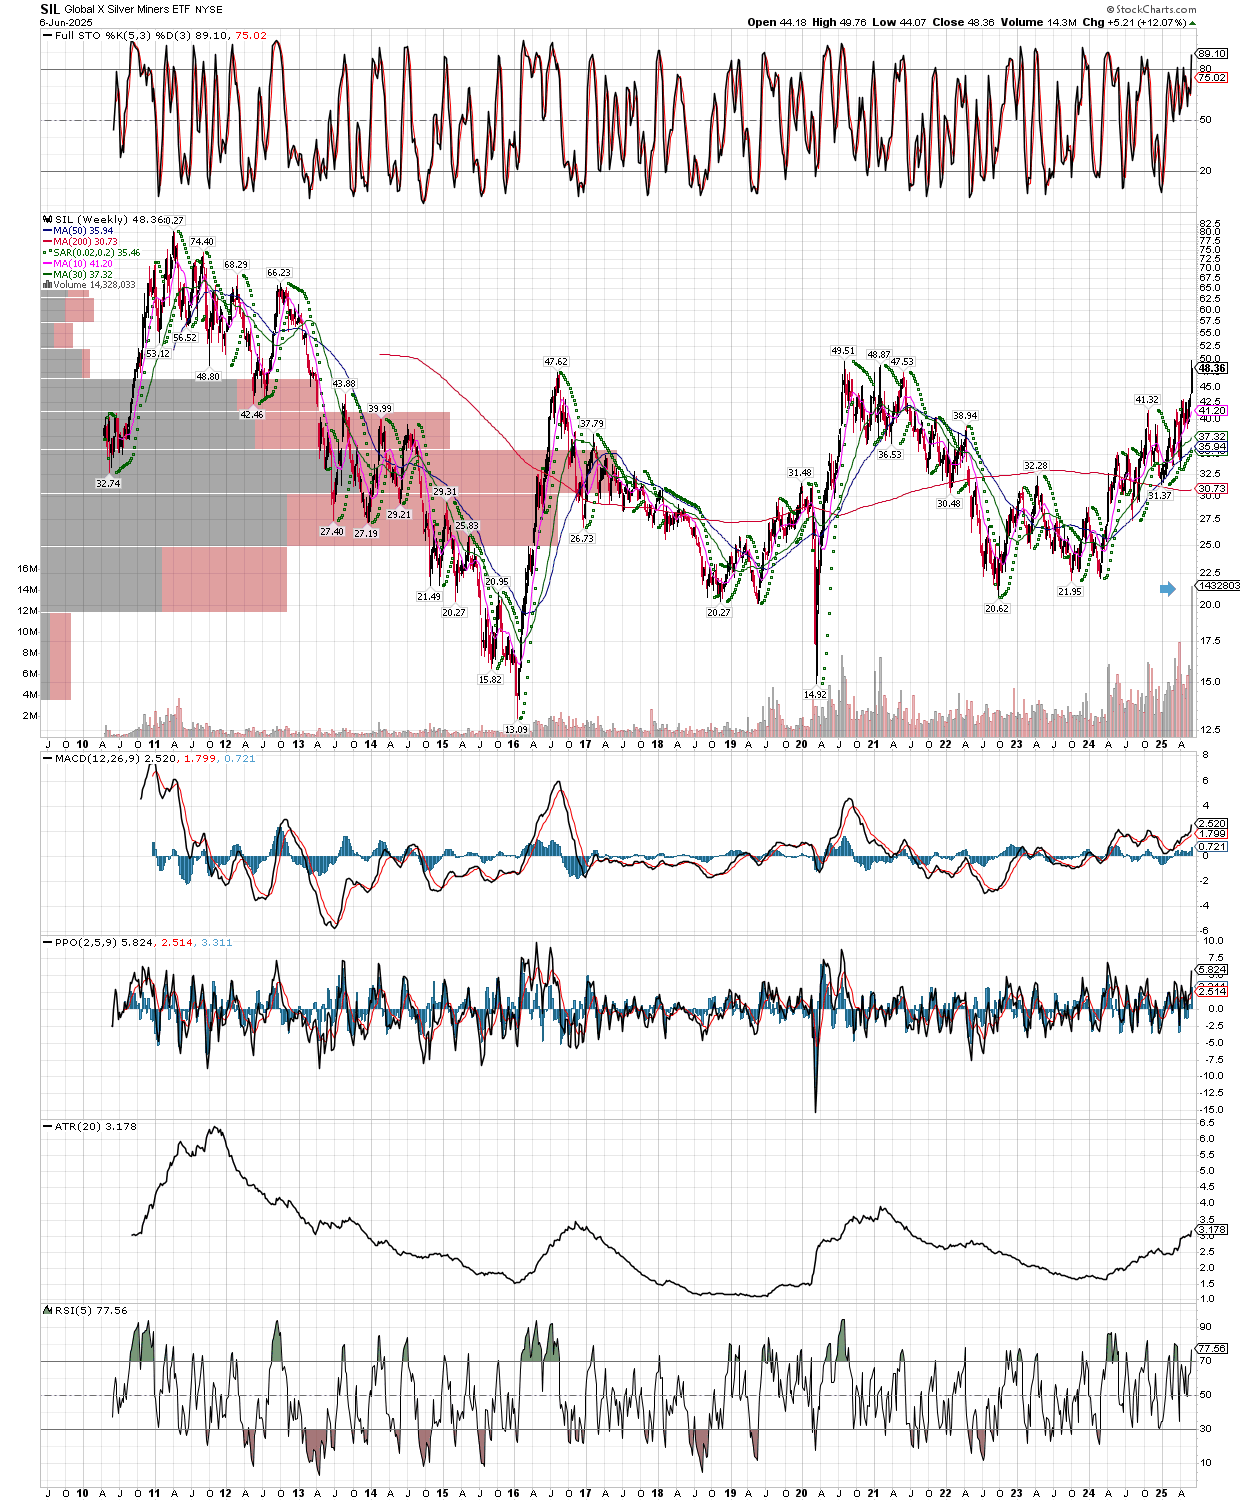
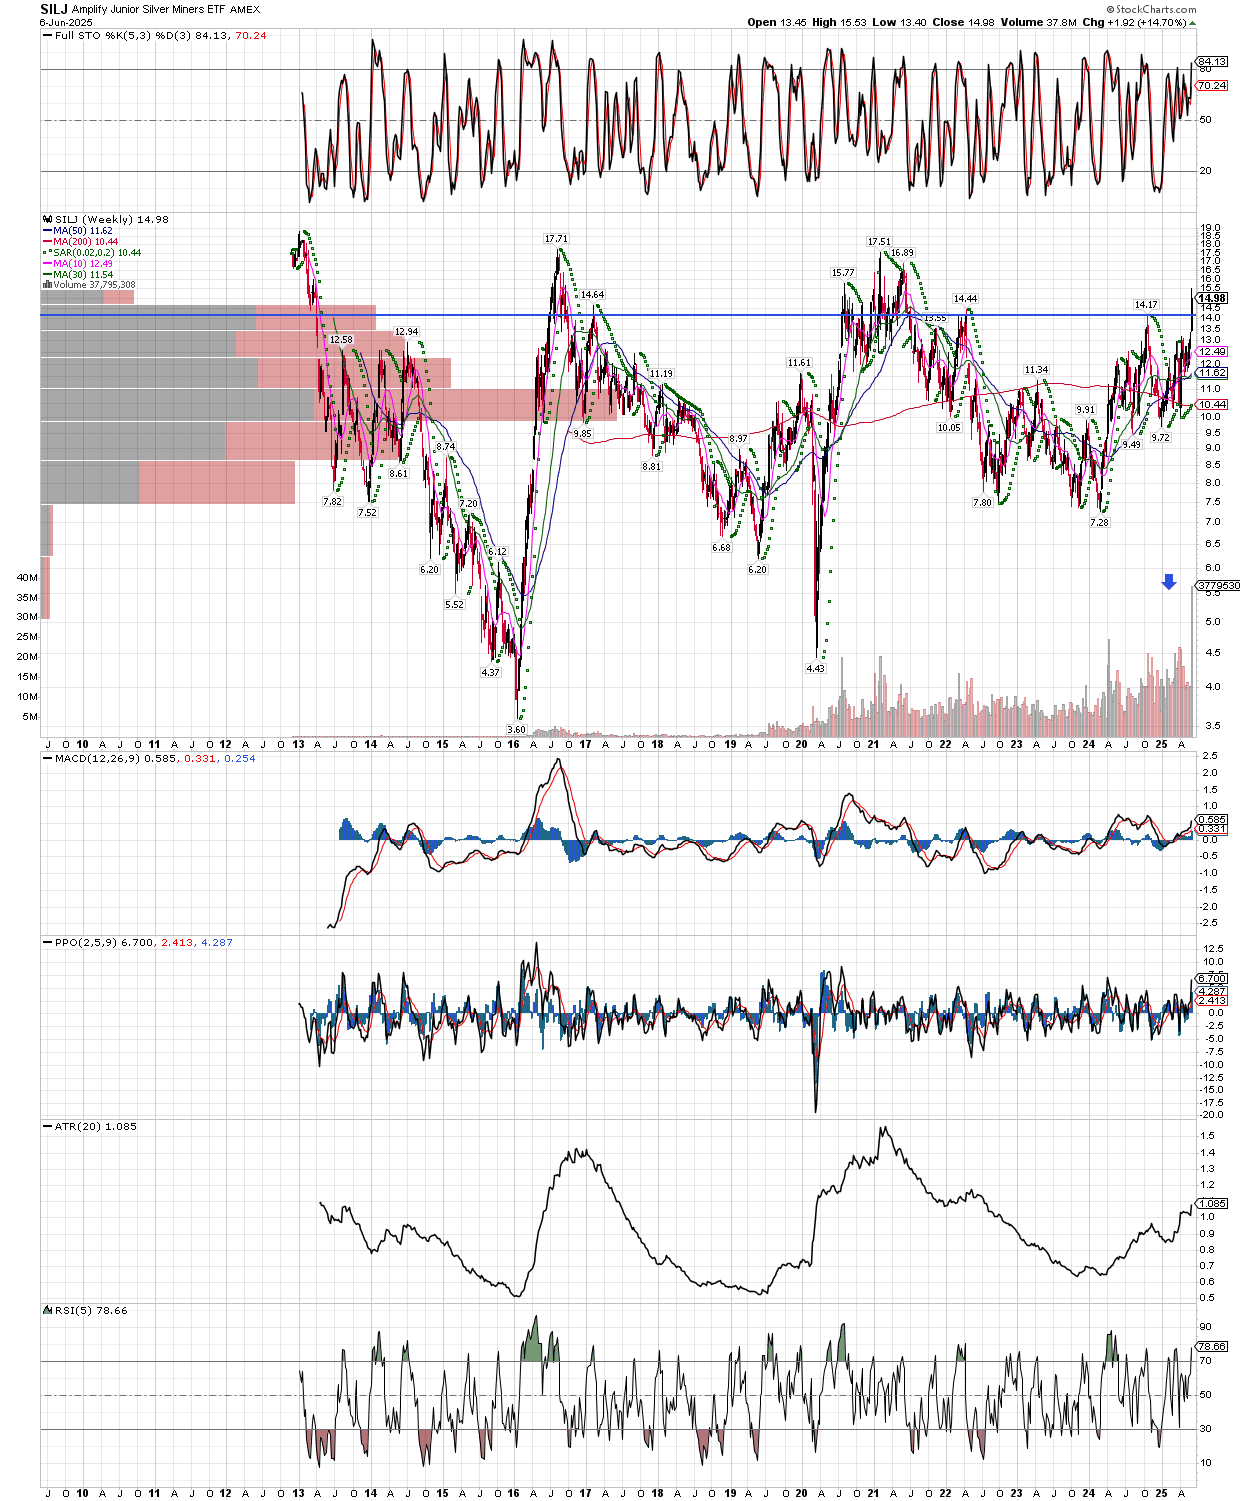
The biggest volume for any week (see blue arrows) since these etfs were created, on the backdrop of Silver breaking out over its last resistance until it attacks the all time-highs near $50. What else needs to be said, better own some metals and miners!
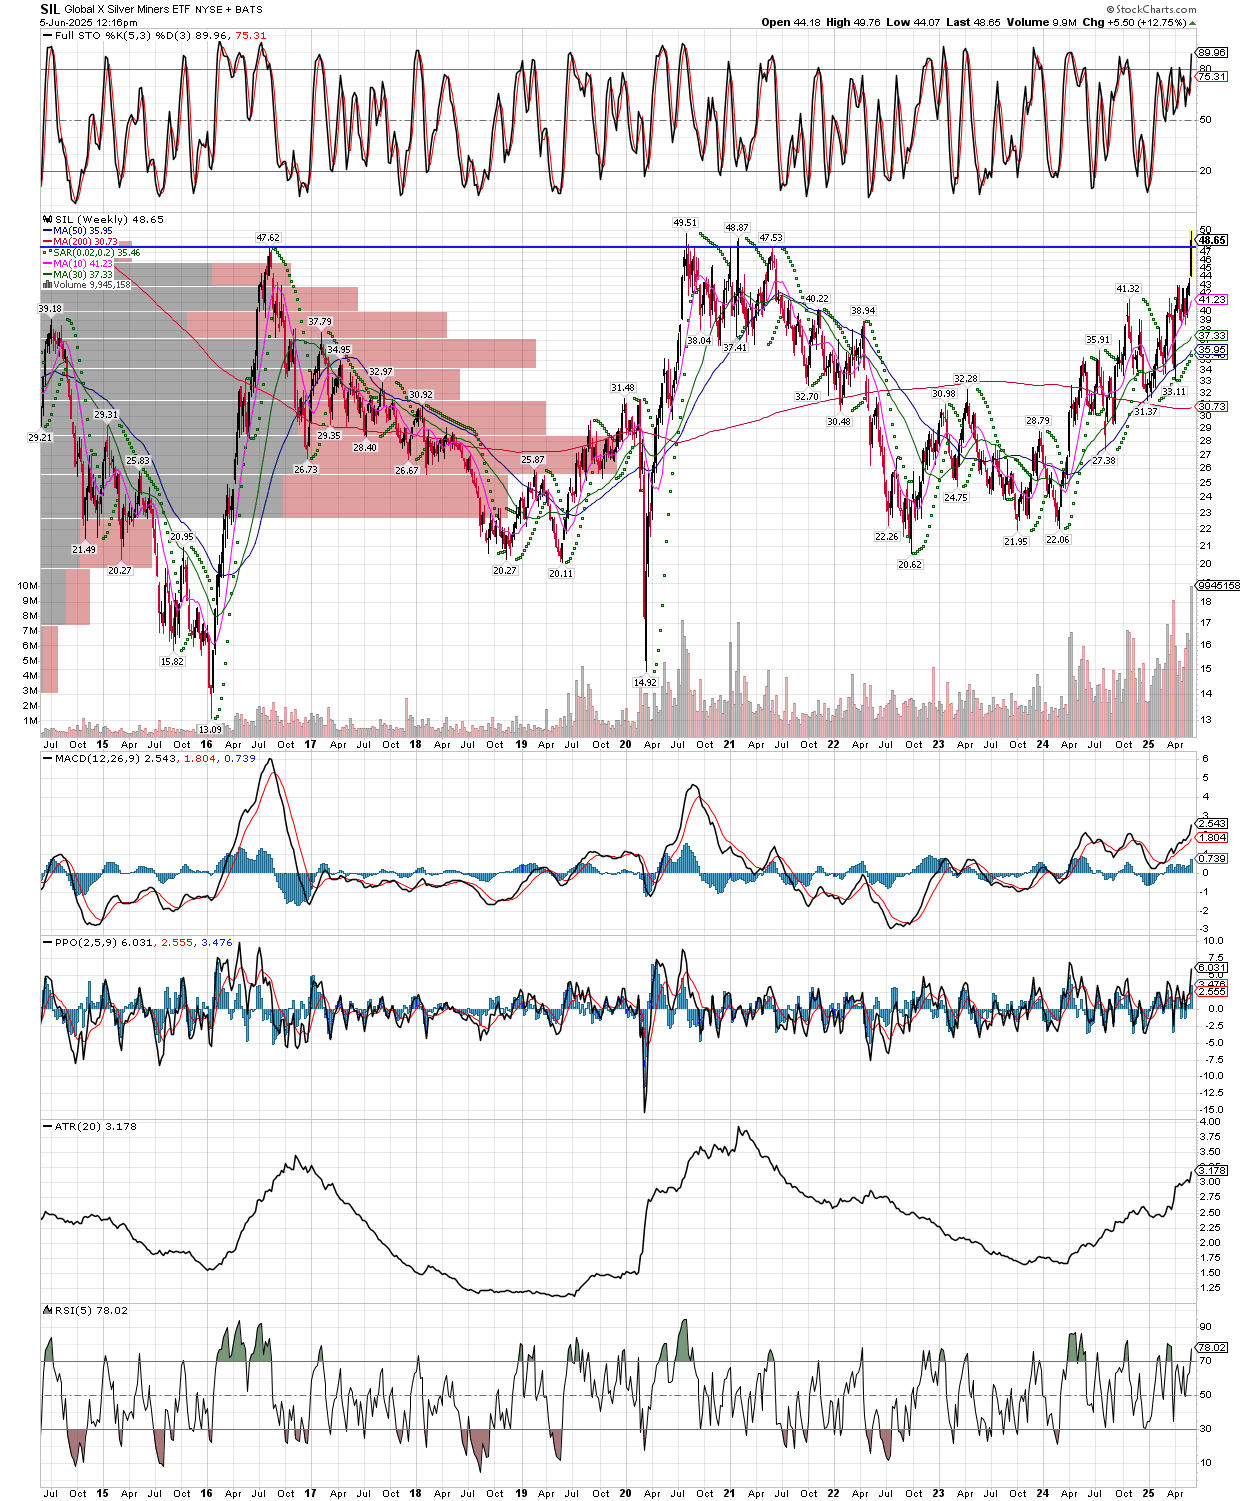
Today I post the SIL etf weekly chart, which is composed of larger silver miners, vs. SILJ which is supposed to focus on junior silver miners, though its weighted heavily towards the mid-caps in the group. Here again we see a significant breakout today, the sixth time SIL has come up to test the $47.50 area. The beautiful thing about this chart is that this move is occurring without much fanfare or participation by investors, also silver itself has just broken the $36 level today, finally clearing the $35 resistance that has held for awhile now. I can confidently say that new all-time highs are in the cards for both SIL and Silver (and SILJ too), and they likely won’t take long to get there. Even better, the percentage gains from here are still substantial, when Silver gets to $50 it will have jumped almost 50% from today’s price, the miners will do even better than that, and the moves in Silver happen very quickly, to add icing on the cake.
Even though we have had a stellar week, one of the best in my career with accounts I manage up more than 20% just this week, there is still tons of upside left in the metals and miners. But you can’t wait much longer, for example, already I would not chase the move with options, or the most speculative juniors since they are both up a lot already in a short period of time. I wouldn’t buy the options here because the upside volatility has exploded and the buyer has to pay up for that, and I won’t add to my junior explorers because they have been starved of operating capital for awhile now, much higher prices and some of them will do secondary offerings in which the dilution will eat up your gains. Still, I have not sold and won’t the options and junior I have at the moment, the unrealized gains are large enough that a dilution for pullback has little chance of knocking me out of the game.
Miners might be moving higher so quickly to catch up to the metals themselves, or investors might be licking their chops thinking of the fat earnings and huge free cash flows that will be reported in the next earnings releases, starting in early August. The miners reported record results for the first quarter, typically the worst of the year for miners, imagine what the numbers will be like this quarter, with higher average selling prices for their metals. In short, the miners have some serious catching up to do, and I am confident they will do it, just like always. They are the place to be now.
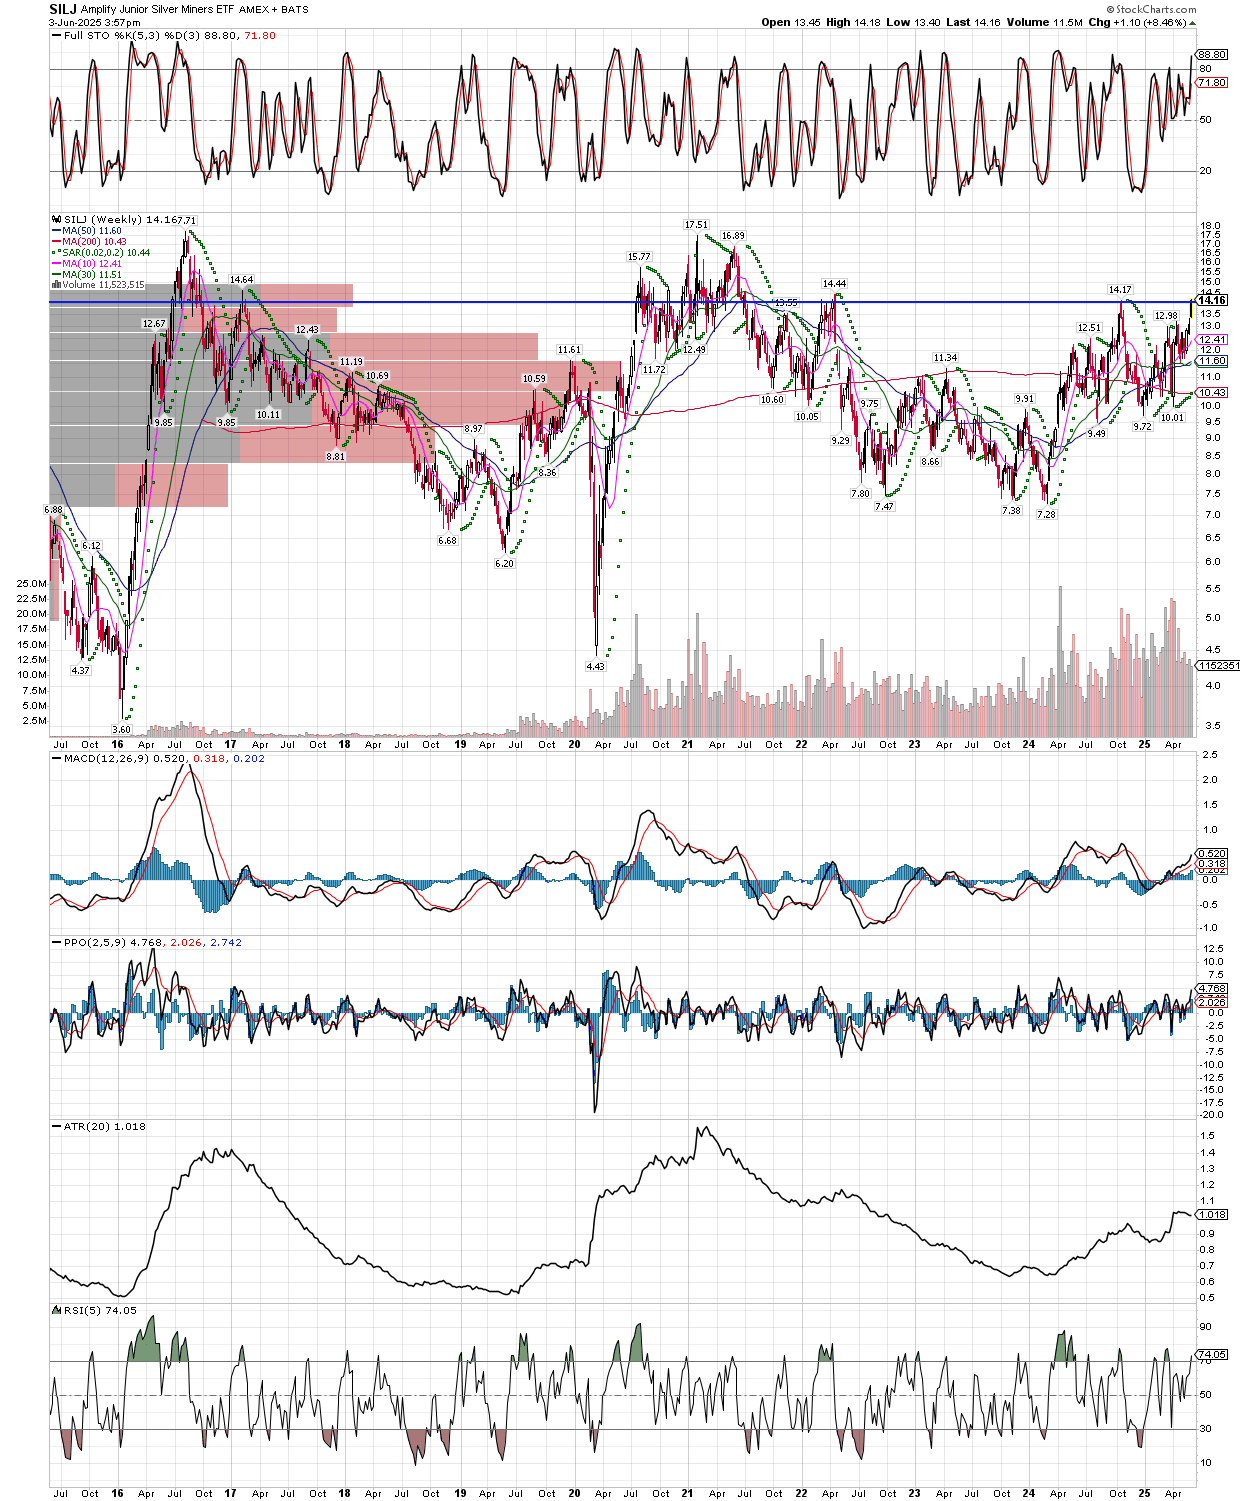
Today the SILJ etf closed at $14.18, just above last October’s high. After this zone with a top end around $14.44, the fund will have little resistance on its way up to its all-time highs, and I truly think SILJ will trade significantly higher than its all-time highs before bull is over. In fact, while there will be painful pullbacks all along the way, the gains that will be made will make up for any pain bulls have felt over the last few years. But you will have to be invested in them, and with a substantial enough bet size, to make any significant difference in your financial future. Simply put, all the stars are aligned now for the miners, both fundamentals and now technicals on the charts. While I am prepared for the occasional turbulence that will jolt the group lower and in a very scary manner, the future upside potential and probability of it occurring is where I keep my focus. The weekly chart below goes back 10 years, note the 2016 run that occurred as the market decided to transition from a mauling bear into a future bull. That run only lasted about 6 months, but we more that tripled our money here at itrade4real.com, aka realprotrader.com. I’m happy to say I nailed it back then, and while I was a fervent bull during the move, I also followed my sell signals when they came, just about top-ticking the market. I don’t want to gloat, but then again, facts are facts.
The more important issue is what about today? Well, I can say that today is more clear than any other time in a bull market. The gains we are seeing in precious metals now, are still just a part of the bigger bull, but the very best part. For those that haven’t been involved, this is the stage where the biggest gains are made, and in the shortest amount of time. Along that thought process, this time will be different from the last highs in silver, for example, made in both 1980 and 2011, because this time silver will blow through those highs so that the $50 level will be the new floor. That means we can only guess what the new ceiling will be in the new trading range that will exist, but I can tell you that a $50 floor on silver has gigantic implications for the prices of mining stocks. They are simply the most hated group ever, and that means just about everybody is a prospect to change their mind once they prove to be the best investment month after month, year after year. There is so much money out there that will be looking to invest in not only the best performing group, but also a group that trades contra to what will continue to fall out of favor, in bonds and the general stock market. Yes, a pullback can and will come at any time, don’t try to sidestep it, use it to add to your positions if its scary enough, and remember that bull markets will correct errors in timing. The important thing to remember is that you have to be involved, the earlier the better. One can’t afford to miss two-day gains in their overall portfolio of 12-13% when they come along, you have to be in them ahead of time, and able to endure the shakeouts.
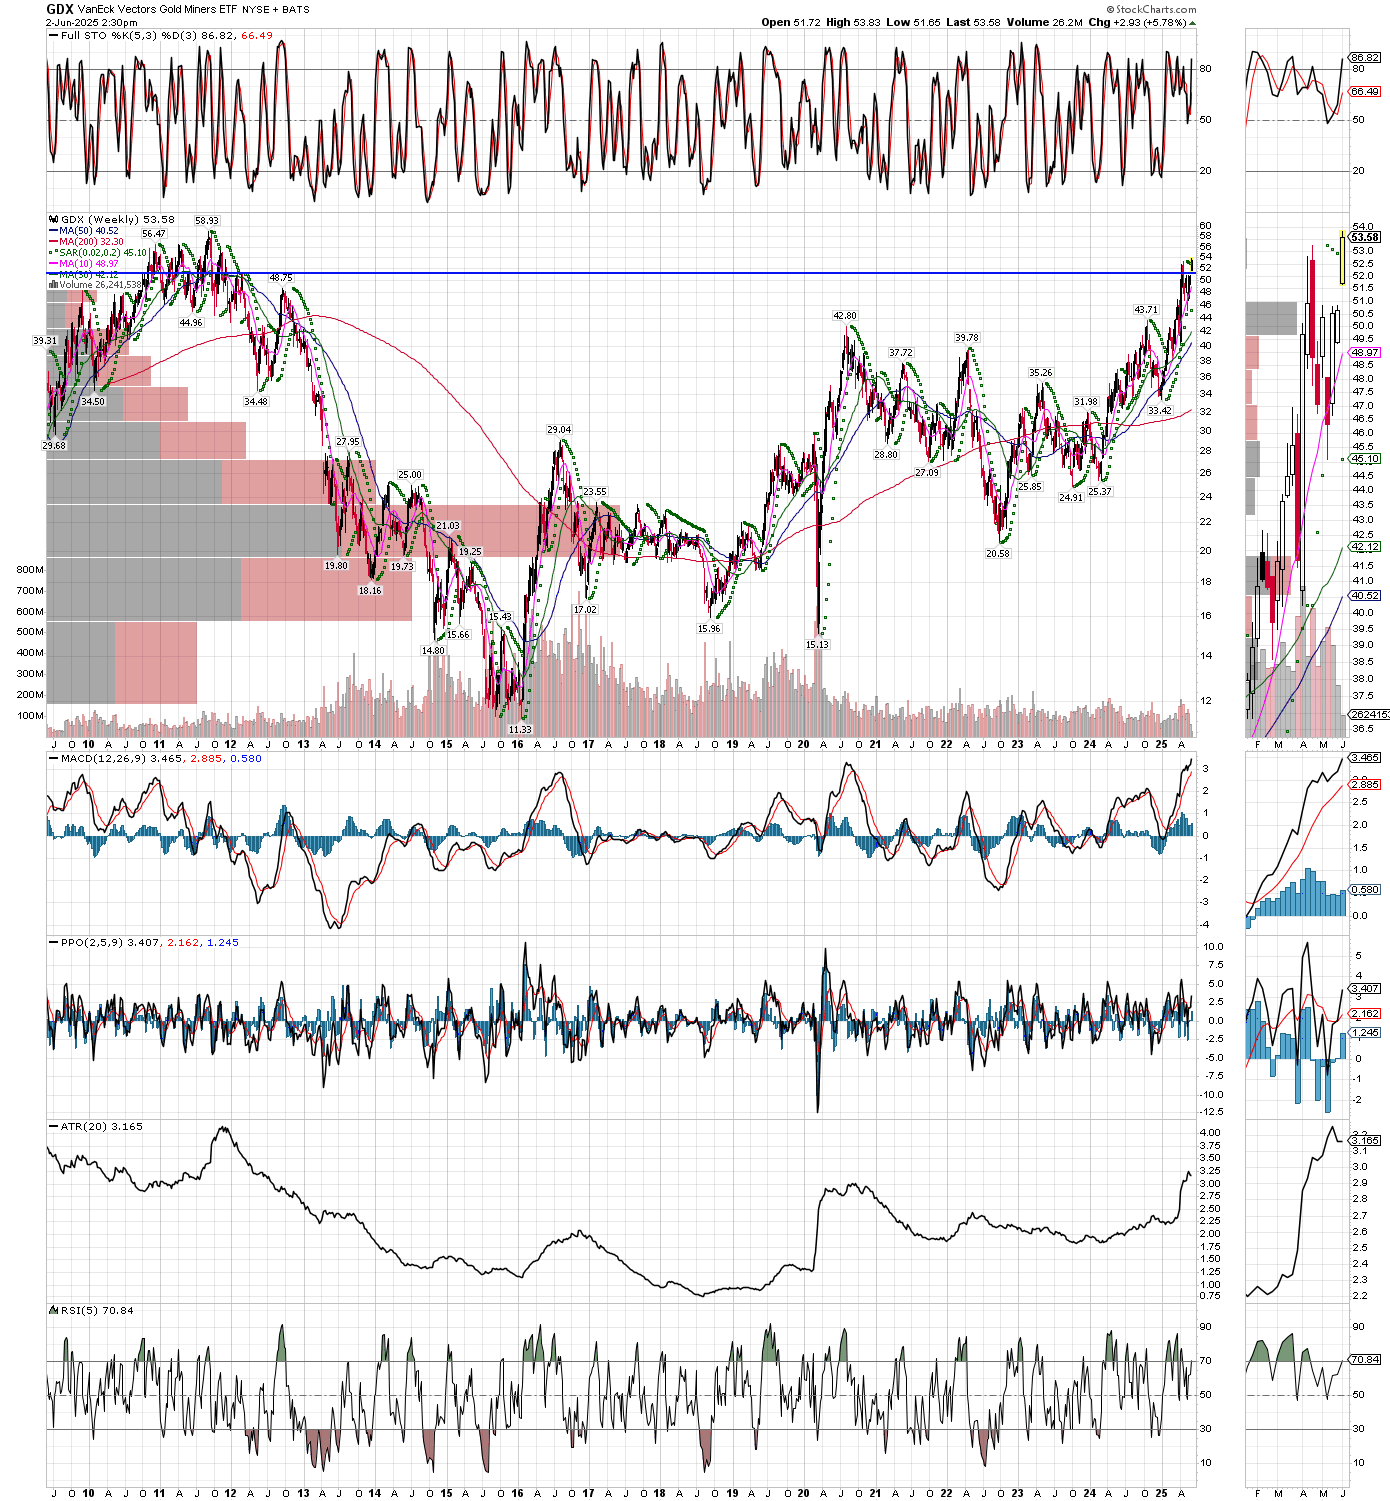
Not only are GDX and GDXJ making new bull market highs today, they are at prices not seen since 2011-2012. SIL and SILJ, the silver miners etfs, are not far behind, either. SIL got within a few pennies of a new bull high, while SIL has already achieved the mark. Many of our miners continue to make new highs, both for this bull, and in many cases all-time highs. It’s not too late, but I’ve learned that chasing moves can hurt, especially in the short term. If not already loaded, one has to weigh the risk of chasing vs the rewards that still lie ahead, and in this observers opinion, it still pays well to get long if you haven’t been invested in the group. That said, I am not buying or adding to positions today, as our accounts are already heavily invested and pushing for more. The best part is today’s huge move up, rare for a Monday, is occurring on no particular news. That is odd, because with so much volume being traded, somebody big is doing plenty of buying. Here is a weekly chart of GDX going back sixteen years, it should be clear to everybody that miners are going higher still.