Pan American Silver (PAAS)
July 12, 2022
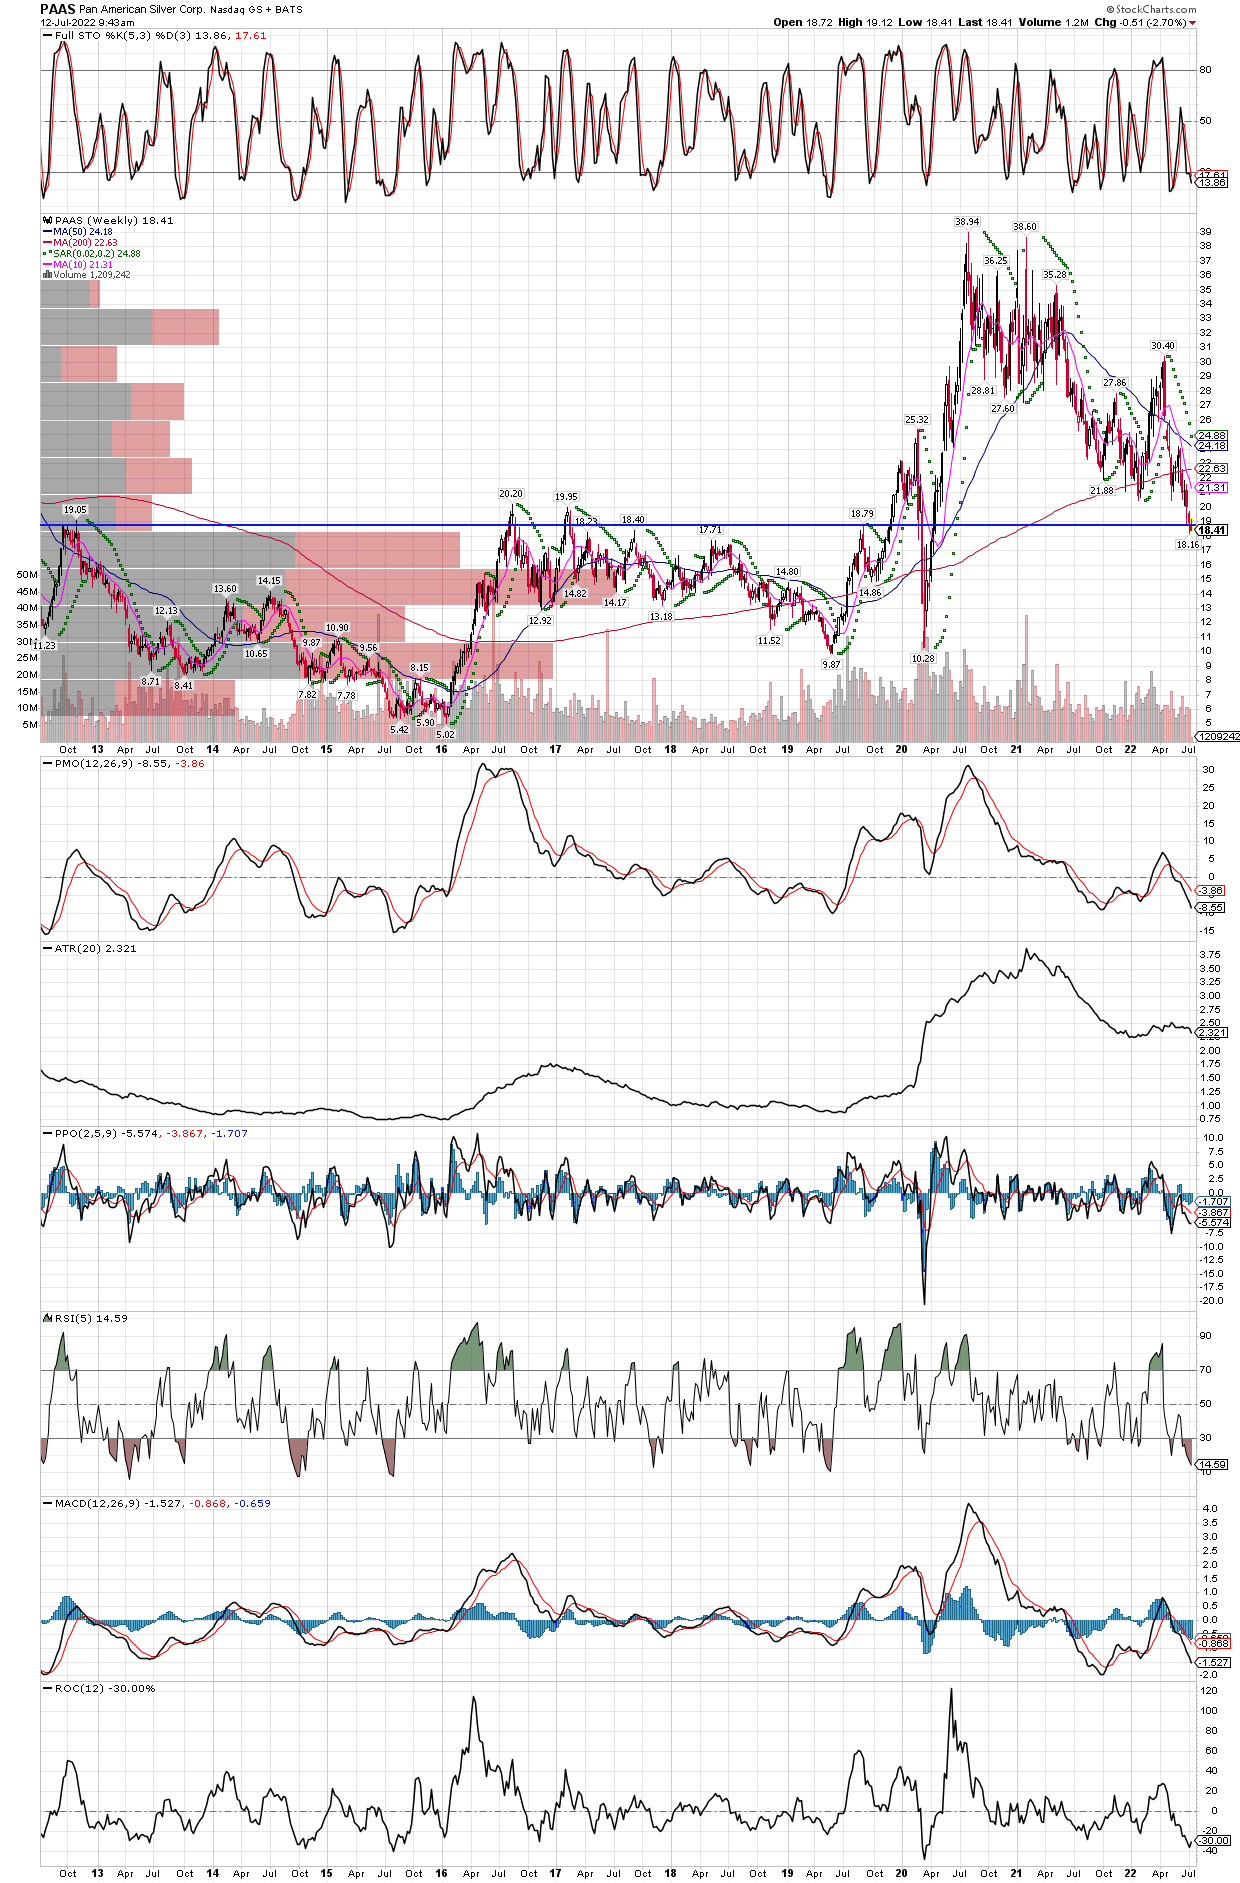
Another similar chart to the Hecla Mining weekly chart posted yesterday, going back 10 years, suggesting support could be found in the stock somewhere in the current zone.
July 12, 2022
Another similar chart to the Hecla Mining weekly chart posted yesterday, going back 10 years, suggesting support could be found in the stock somewhere in the current zone.